EUR/USD Price Analysis: Corrective pullback prints falling wedge below 1.1900


  • EUR/USD bounces off early April lows, refreshes intraday high of late.
  • RSI recovery from oversold area backs bullish chart pattern’s confirmation.
  • Previous support line, 200-HMA adds to the upside filters.

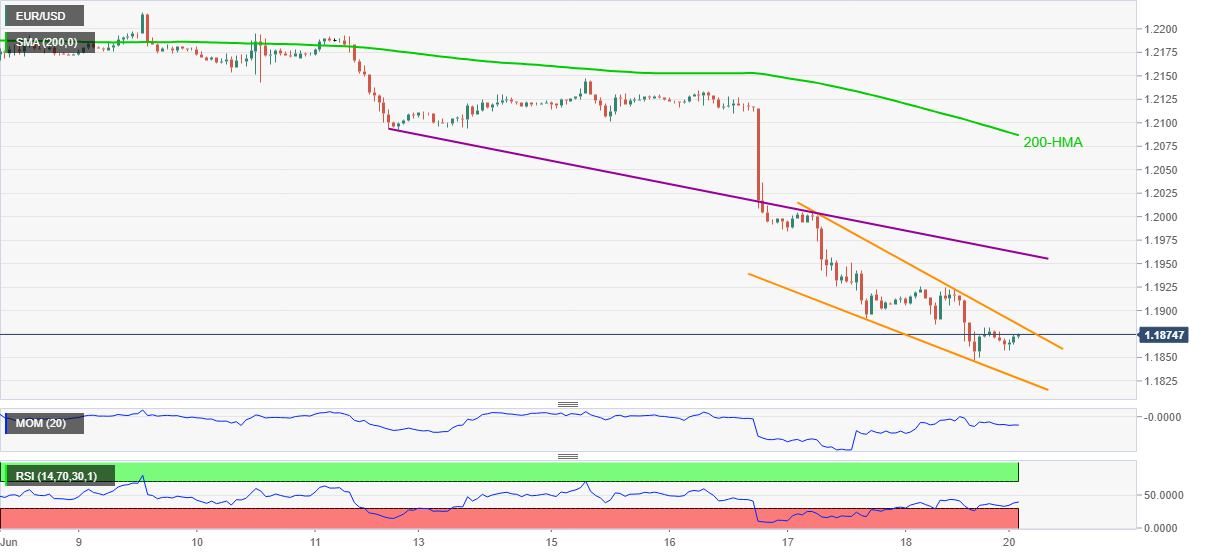
EUR/USD extends late Friday’s recovery towards 1.1900, up 0.10% around 1.1875, during Monday Asian session. In doing so, the currency major portrays a bullish chart pattern, falling wedge, near the lowest levels since April 08.

Given the RSI’s U-turn from oversold territory gaining support from the strong Momentum line, EUR/USD may extend the corrective pullback towards the 1.1900 threshold. However, the stated formation’s resistance line near 1.1885 becomes an immediate hurdle to cross.

Although falling wedge breakout gains momentum near the multi-day low, if broken, a descending resistance line from June 11 near 1.1960 could probe the bulls holding the theoretical target over the 1.2000 psychological magnet. It’s worth noting that the EUR/USD buyers will remain cautious unless witnessing a clear break of the 200-HMA level around 1.2085.

Alternatively, the recent low near 1.1850 and the stated pattern’s support line close to 1.1825 could test the pair sellers during the fresh downside.

In a case where EUR/USD bears keep the reins below 1.1825, the 1.1800 round figure and the yearly bottom near 1.1705 will be on their radars.

EUR/USD hourly chart

Trend: Further recovery expected

Additional important levels

Overview
Today last price 1.1874
Today Daily Change 0.0010
Today Daily Change % 0.08%
Today daily open 1.1864
 
Trends
Daily SMA20 1.2142
Daily SMA50 1.2097
Daily SMA100 1.2036
Daily SMA200 1.1995
 
Levels
Previous Daily High 1.1925
Previous Daily Low 1.1847
Previous Weekly High 1.2147
Previous Weekly Low 1.1847
Previous Monthly High 1.2266
Previous Monthly Low 1.1986
Daily Fibonacci 38.2% 1.1877
Daily Fibonacci 61.8% 1.1895
Daily Pivot Point S1 1.1832
Daily Pivot Point S2 1.1801
Daily Pivot Point S3 1.1755
Daily Pivot Point R1 1.191
Daily Pivot Point R2 1.1957
Daily Pivot Point R3 1.1988


Share: Feed news

Information on these pages contains forward-looking statements that involve risks and uncertainties. Markets and instruments profiled on this page are for informational purposes only and should not in any way come across as a recommendation to buy or sell in these assets. You should do your own thorough research before making any investment decisions. FXStreet does not in any way guarantee that this information is free from mistakes, errors, or material misstatements. It also does not guarantee that this information is of a timely nature. Investing in Open Markets involves a great deal of risk, including the loss of all or a portion of your investment, as well as emotional distress. All risks, losses and costs associated with investing, including total loss of principal, are your responsibility. The views and opinions expressed in this article are those of the authors and do not necessarily reflect the official policy or position of FXStreet nor its advertisers. The author will not be held responsible for information that is found at the end of links posted on this page.

If not otherwise explicitly mentioned in the body of the article, at the time of writing, the author has no position in any stock mentioned in this article and no business relationship with any company mentioned. The author has not received compensation for writing this article, other than from FXStreet.

FXStreet and the author do not provide personalized recommendations. The author makes no representations as to the accuracy, completeness, or suitability of this information. FXStreet and the author will not be liable for any errors, omissions or any losses, injuries or damages arising from this information and its display or use. Errors and omissions excepted.

The author and FXStreet are not registered investment advisors and nothing in this article is intended to be investment advice.

Recommended content


Recommended content

Editors’ Picks

EUR/USD edges lower toward 1.0700 post-US PCE

EUR/USD edges lower toward 1.0700 post-US PCE

EUR/USD stays under modest bearish pressure but manages to hold above 1.0700 in the American session on Friday. The US Dollar (USD) gathers strength against its rivals after the stronger-than-forecast PCE inflation data, not allowing the pair to gain traction.

EUR/USD News

GBP/USD retreats to 1.2500 on renewed USD strength

GBP/USD retreats to 1.2500 on renewed USD strength

GBP/USD lost its traction and turned negative on the day near 1.2500. Following the stronger-than-expected PCE inflation readings from the US, the USD stays resilient and makes it difficult for the pair to gather recovery momentum.

GBP/USD News

Gold struggles to hold above $2,350 following US inflation

Gold struggles to hold above $2,350 following US inflation

Gold turned south and declined toward $2,340, erasing a large portion of its daily gains, as the USD benefited from PCE inflation data. The benchmark 10-year US yield, however, stays in negative territory and helps XAU/USD limit its losses. 

Gold News

Bitcoin Weekly Forecast: BTC’s next breakout could propel it to $80,000 Premium

Bitcoin Weekly Forecast: BTC’s next breakout could propel it to $80,000

Bitcoin’s recent price consolidation could be nearing its end as technical indicators and on-chain metrics suggest a potential upward breakout. However, this move would not be straightforward and could punish impatient investors. 

Read more

Week ahead – Hawkish risk as Fed and NFP on tap, Eurozone data eyed too

Week ahead – Hawkish risk as Fed and NFP on tap, Eurozone data eyed too

Fed meets on Wednesday as US inflation stays elevated. Will Friday’s jobs report bring relief or more angst for the markets? Eurozone flash GDP and CPI numbers in focus for the Euro.

Read more

Forex MAJORS

Cryptocurrencies

Signatures