|

EUR/USD Price Analysis: Consolidates near two-week high, setup favours bullish traders

  • EUR/USD consolidates Thursday’s strong move up to over a two-week high.
  • Acceptance above the 1.0745-50 confluence hurdle favours bullish traders.
  • A convincing beak below the 1.0700 mark will negate the positive outlook.

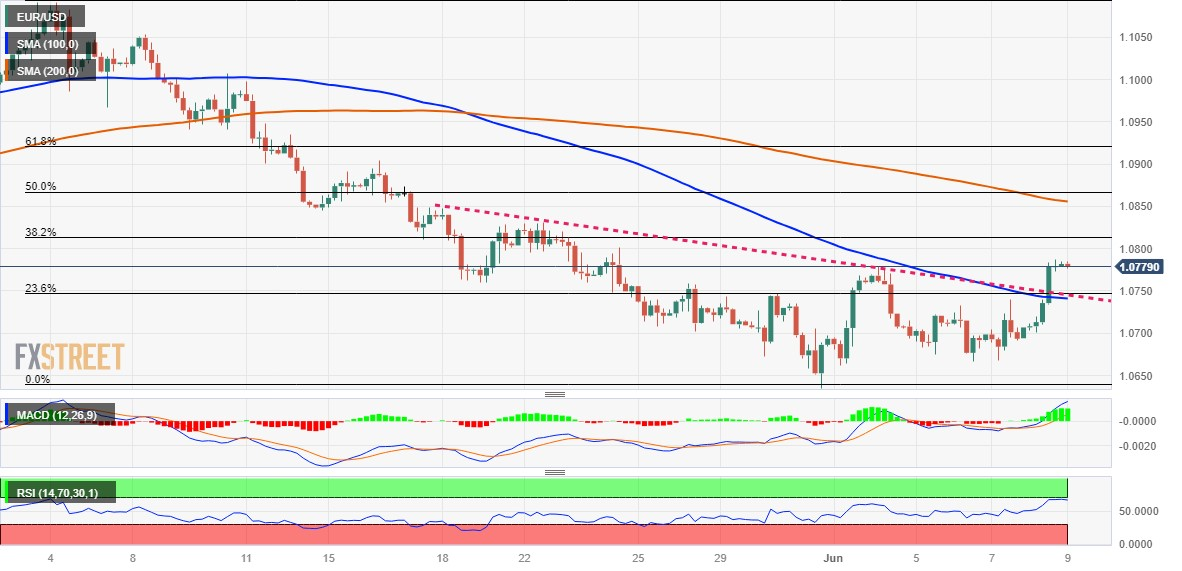
The EUR/USD pair is seen consolidating the previous day's strong gains to over a two-week high and oscillating in a narrow trading band through the Asian session on Friday. Spot prices currently trade around the 1.0775-1.0780 region and seem poised to build on the recent bounce from the 1.0635 region, or the lowest level since March 20 touched last week.

The overnight sharp rise confirms a breakout through the 1.0745 confluence - comprising the 100-period Simple Moving Average (SMA), the 23.6% Fibonacci retracement level of the downfall witnessed in May and a short-term descending trend-line. This, in turn, favours bullish traders and supports prospects for a further near-term appreciating move. That said, technical indicators on the daily chart - though have recovered from the negative territory - are yet to confirm a bullish outlook. Hence, any subsequent move up is more likely to confront some resistance near the 1.0800 round-figure mark, representing the 38.2% Fibo. level.

Some follow-through buying, however, will set the stage for additional gains and lift the EUR/USD pair to the next relevant hurdle near the 1.0860 region. The latter represents the 200-period SMA on the 4-hour chart and the 50% Fibo. level, which if cleared decisively will suggest that the recent pullback from over a one-year high touched in May has run its course. Spot prices might then aim to surpass the 1.0900 round figure and test the 61.8% Fibo. level, around the 1.0915-1.0920 zone.

On the flip side, the 1.0750-1.0745 confluence resistance breakpoint now seems to protect the immediate downside ahead of the 1.0700 mark. This is closely followed by an upward sloping trend-line, currently pegged near the 1.0680 region, below which the EUR/USD pair could slide back towards the May monthly swing low, around the 1.0635 area. Some follow-through selling will be seen as a fresh trigger for bearish traders and drag spot prices below the 1.0600 mark, towards testing the 1.0540-1.0535 intermediate support en route to the 1.0500 psychological mark.

EUR/USD 4-hour chart

fxsoriginal

Key levels to watch

EUR/USD

Overview
Today last price1.0778
Today Daily Change-0.0004
Today Daily Change %-0.04
Today daily open1.0782
 
Trends
Daily SMA201.0764
Daily SMA501.0887
Daily SMA1001.0809
Daily SMA2001.0516
 
Levels
Previous Daily High1.0787
Previous Daily Low1.0696
Previous Weekly High1.0779
Previous Weekly Low1.0635
Previous Monthly High1.1092
Previous Monthly Low1.0635
Daily Fibonacci 38.2%1.0752
Daily Fibonacci 61.8%1.0731
Daily Pivot Point S11.0723
Daily Pivot Point S21.0664
Daily Pivot Point S31.0632
Daily Pivot Point R11.0814
Daily Pivot Point R21.0846
Daily Pivot Point R31.0906

Author

Haresh Menghani

Haresh Menghani is a detail-oriented professional with 10+ years of extensive experience in analysing the global financial markets.

More from Haresh Menghani
Share:

Editor's Picks

EUR/USD rebounds from session lows, stays below 1.1650

EUR/USD is recovers modestly from session lows but remains in the red below 1.1650 in European trading on Thursday. The pair faces headwinds from a renewed uptick in the US Dollar amid a negative shift in risk sentiment. Surging energy prices due to the Middle East war keep the bearish pressure intact on the Euro. The US Jobless Claims data are next of note. 

GBP/USD stays weak near 1.3350 amid UK stagflation risks

GBP/USD sticks to losses near 1.3350 in the European session on Thursday. The Pound Sterling loses ground amid fears that the United Kingdom economy could face stagflation risks due to higher energy prices, while the US Dollar attracts fresh havem demand ahead of the US Jobless Claims data. 

Gold climbs near $5,200 as Iran war fuels safe-haven demand

Gold price extends its gains for the second successive session on Thursday as traders seek safety amid the ongoing war in the Middle East. US and Israeli strikes across Iranian territory and widespread Iranian missile and drone retaliation across the Middle East, including attacks on regional targets and military sites, prolong the crisis and its impact.

Three reasons to be bearish on Bitcoin

Bitcoin is holding up well taking into account the uncertainty stemming from the Middle East. Despite this week’s rally, the long-term outlook remains bearish. Here are three reasons why I think the storm for the largest cryptocurrency isn't over yet.

Markets attempt to rally on positive news from Iran

There’s been an abrupt change in sentiment this morning, European stock markets are higher and oil and gas prices are moderating, after comments from Iran’s deputy minister about pre-conflict talks between Iran and the US.

Cardano Price Analysis: Approaches key trendline amid bearish sentiment

Cardano (ADA) price is approaching its descending trendline around $0.28 at the time of writing, set to shape the next directional move. The derivatives metrics paint a bearish picture, with ADA’s Open Interest continuing to fall and short bets rising among traders.