|

EUR/USD Price Analysis: Bulls reclaim momentum as pair nears November highs

  • EUR/USD was seen trading around the 1.0900 area after the European session, extending its recent rally.
  • Following a brief pause on Monday, the pair surged by more than 0.70%, approaching its highest levels since November 2024.
  • Technical indicators remain in overbought territory, signaling potential exhaustion, while key resistance levels lie ahead.

The EUR/USD pair regained bullish traction on Tuesday after the European session, advancing past the 1.0900 zone and continuing its strong upward trend. After stalling briefly on Monday, buyers re-entered the market, fueling a more than 0.70% rally. The pair now hovers near its highest levels since November 2024, with market momentum firmly favoring the bulls.

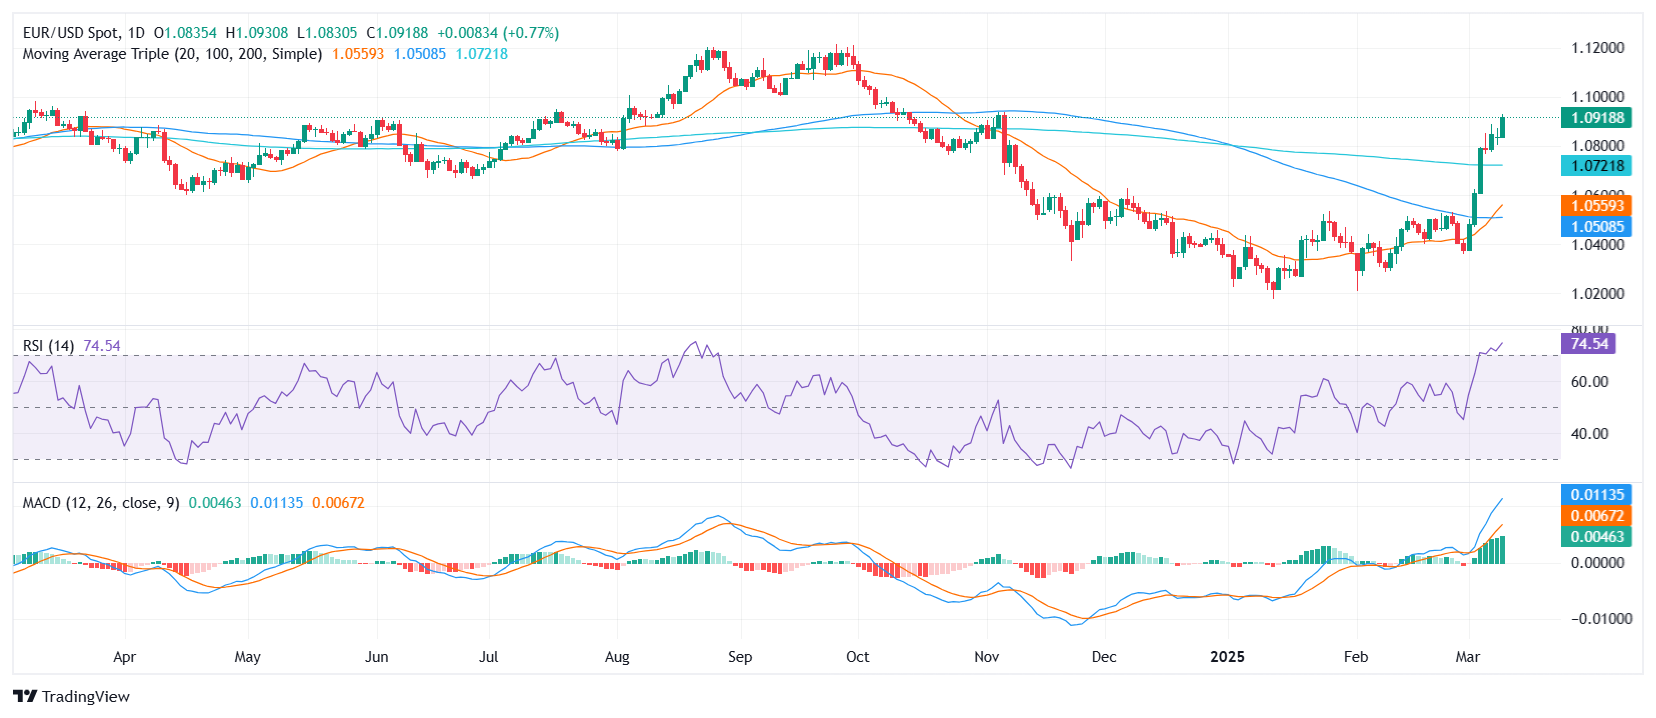
From a technical perspective, the Relative Strength Index (RSI) has climbed further into overbought territory, rising sharply to indicate strong buying pressure. Meanwhile, the Moving Average Convergence Divergence (MACD) continues to print rising green bars, reflecting sustained bullish momentum. However, these overbought conditions suggest a possible correction could be on the horizon if buyers start to take profits.

Looking at key levels, immediate resistance is now seen near the 1.0930 zone, a break of which could open the door toward the 1.0970-1.1000 range. On the downside, support is aligned near the 1.0850 region, followed by the 1.0800 psychological level, where the 200-day Simple Moving Average (SMA) is positioned.

EUR/USD daily chart

Author

Patricio Martín

Patricio is an economist from Argentina passionate about global finance and understanding the daily movements of the markets.

More from Patricio Martín
Share:

Markets move fast. We move first.

Orange Juice Newsletter brings you expert driven insights - not headlines. Every day on your inbox.

By subscribing you agree to our Terms and conditions.

Editor's Picks

EUR/USD: Bulls pray for a dovish Fed

EUR/USD has finally taken a breather after a pretty energetic climb. The pair broke above 1.1680 in the second half of the week, reaching its highest levels in around two months before running into some selling pressure. Even so, it has gained almost two cents from the late-November dip just below 1.1500 the figure.

GBP/USD trims gains, recedes toward 1.3320

GBP/USD is struggling to keep its daily advance, coming under fresh pressure and retreating to the 1.3320 zone following a mild bullish attempt in the Greenback. Even though US consumer sentiment surprised to the upside, the US Dollar isn’t getting much love, as traders are far more interested in what the Fed will say next week.

Gold: Bullish momentum fades despite broad USD weakness

After rising more than 3.5% in the previous week, Gold has entered a consolidation phase and fluctuated at around $4,200. The Federal Reserve’s interest rate decision and revised Summary of Economic Projections, also known as the dot plot, could trigger the next directional move in XAU/USD. 

Week ahead: Rate cut or market shock? The Fed decides

Fed rate cut widely expected; dot plot and overall meeting rhetoric also matter. Risk appetite is supported by Fed rate cut expectations; cryptos show signs of life. RBA, BoC and SNB also meet; chances of surprises are relatively low. Dollar weakness could linger; both the aussie and the yen best positioned to gain further. Gold and oil eye Ukraine-Russia developments; a peace deal remains elusive.

Week ahead – Rate cut or market shock? The Fed decides

Fed rate cut widely expected; dot plot and overall meeting rhetoric also matter. Risk appetite is supported by Fed rate cut expectations; cryptos show signs of life. RBA, BoC and SNB also meet; chances of surprises are relatively low.

Ripple faces persistent bear risks, shrugging off ETF inflows

Ripple is extending its decline for the second consecutive day, trading at $2.06 at the time of writing on Friday. Sentiment surrounding the cross-border remittance token continues to lag despite steady inflows into XRP spot ETFs.