|

EUR/USD Price Analysis: Bulls push above the 200-day SMA as rally extends

  • EUR/USD advanced after the European session, trading above the 200-day SMA near the 1.0830 region as bullish momentum continued.
  • The pair has gained nearly 5% this week, breaking key resistance and signaling a potential continuation of the uptrend.
  • Key resistance emerges near 1.0900, while support now aligns at the 200-day SMA around 1.0830.

EUR/USD extended its rally on Thursday, climbing past the 200-day Simple Moving Average (SMA) after the European session, signaling strong bullish momentum. The pair has now added close to 5% this week, reinforcing buyers' control as technical indicators remain in favor of further gains.

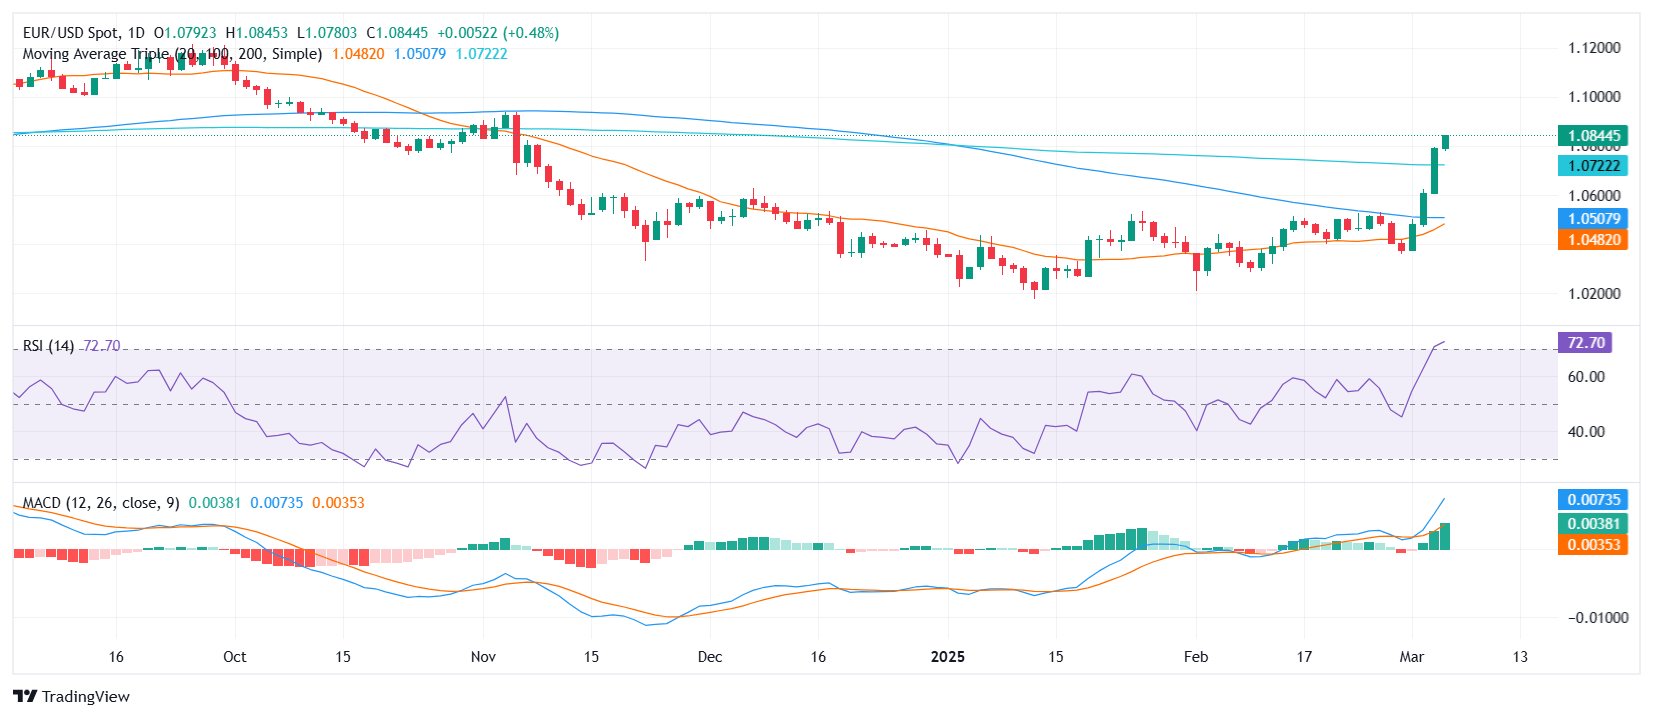
The Relative Strength Index (RSI) remains in overbought territory but is only mildly rising, suggesting that while the pair retains bullish momentum, profit-taking or a temporary pullback could emerge. Meanwhile, the Moving Average Convergence Divergence (MACD) continues to print rising green bars, confirming the ongoing upside bias.

Now that EUR/USD has decisively moved above the 200-day SMA, the next key resistance is seen around the 1.0900 region. A sustained break above this level could open the door for further gains toward 1.0950. On the downside, the 200-day SMA, now acting as immediate support, sits around 1.0830, with additional buying interest likely near 1.0750.

EUR/USD daily chart

Author

Patricio Martín

Patricio is an economist from Argentina passionate about global finance and understanding the daily movements of the markets.

More from Patricio Martín
Share:

Editor's Picks

EUR/USD edges lower below 1.1650 as Middle East tensions fuel US Dollar strength

The EUR/USD pair trades in negative territory around 1.1635 during the early Asian session on Thursday. The US Dollar strengthens against the Euro as escalating Middle East conflict boosts safe-haven flows. Traders brace for the Eurozone Retail Sales and US weekly Initial Jobless Claims reports, which will be released later on Thursday. 

GBP/USD tests key moving averages as growth downgrade weighs

GBP/USD was nearly flat on Wednesday, edging up 0.08% to settle around 1.3370 in a quiet session. The pair has fallen sharply from its late-January high near 1.3870 and is now testing the 200-day Exponential Moving Average, with this week's one-week forex heatmap showing Pound Sterling as one of the worst performers against the US Dollar, down about 1.4% on the week.

Gold benefits from a retreating USD; reduced Fed rate cut bets cap gains

Gold attracts some buyers for the second consecutive day on Thursday amid a modest US Dollar pullback from an over three-month high, though it remains below the $5,200 mark. Wednesday's upbeat US macro data further tempered hopes for three rate cuts by the Fed in 2026. Furthermore, escalating Middle East tensions might continue to benefit the USD's status as the global reserve currency and contribute to capping the bullion.

Morgan Stanley files amended S-1 for spot Bitcoin ETF

Morgan Stanley submitted an amended S-1 filing to the US Securities and Exchange Commission on Wednesday, providing additional details on its proposed Bitcoin exchange-traded fund.

First Venezuela, now Iran: The US-China energy war escalates

At first glance, the latest escalation involving the United States with both Iran and Venezuela looks like another chapter in a long-running geopolitical story. But viewed through a broader strategic lens, something else may be unfolding: Energy.

Bittensor extends recovery despite retail demand slump

Bittensor, a leading Artificial Intelligence token, is aging up above $190 at the time of writing on Wednesday. Steady price increases characterise the broader crypto market, with Bitcoin holding above $71,000 and Ethereum above $2,000.