EUR/USD Price Analysis: Bulls eyes multi-month-old resistance as Euro approaches 1.0900


  • EUR/USD prints six-day winning streak, stays firmer around the highest levels since early February.
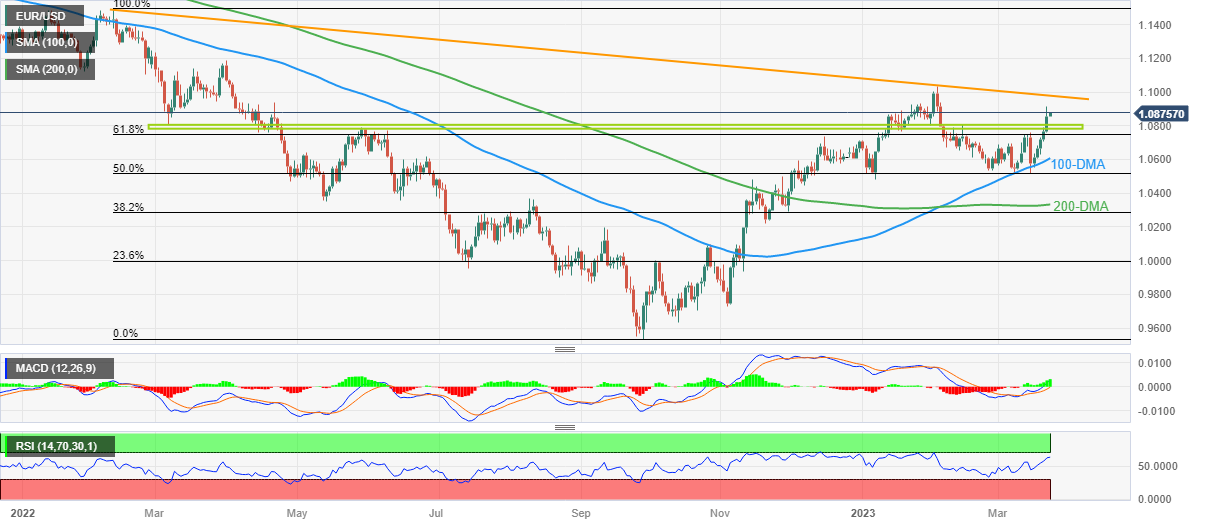
  • Clear upside break of one-year-long horizontal resistance, now support, joins upbeat oscillators to favor Euro bulls.
  • Sustained bounce off 100-DMA, 50% Fibonacci retracement also strength bullish bias.
  • Sellers need validation from 200-DMA to retake control.

EUR/USD picks up bids to refresh intraday high near 1.0875 as bulls keep the reins for the sixth consecutive day to early Thursday. In doing so, the major currency pair remains firmer around the highest levels in seven weeks, marked the previous day.

That said, the quote’s upside momentum gains validation from a successful break of the one-year-long horizontal resistance, now support around 1.0805-785.

Also favoring the bulls is the EUR/USD pair’s sustained rebound from the 100-DMA, around 1.0605 by the press time, as well as from the 50% Fibonacci retracement of the pair’s downside from February to September 2022, near 1.0515.

Additionally, bullish MACD signals and the firmer Relative Strength Index (RSI) line, not overbought, also underpin the bullish bias about the EUR/USD pair.

It should be noted that the 200-DMA level surrounding 1.0335 acts as the last defense of the EUR/USD buyers.

On the flip side, a 13-month-old descending resistance line, around 1.0985, lures the EUR/USD bulls ahead of the 1.1000 psychological magnet. Following that, the yearly high of 1.1033 and the March 2022 top surrounding 1.1185 could lure the pair buyers.

EUR/USD: Daily chart

Trend: Further upside expected

Additional important levels

Overview
Today last price 1.0874
Today Daily Change 0.0018
Today Daily Change % 0.17%
Today daily open 1.0856
 
Trends
Daily SMA20 1.0644
Daily SMA50 1.0731
Daily SMA100 1.0597
Daily SMA200 1.0331
 
Levels
Previous Daily High 1.0912
Previous Daily Low 1.0759
Previous Weekly High 1.076
Previous Weekly Low 1.0516
Previous Monthly High 1.1033
Previous Monthly Low 1.0533
Daily Fibonacci 38.2% 1.0854
Daily Fibonacci 61.8% 1.0818
Daily Pivot Point S1 1.0772
Daily Pivot Point S2 1.0689
Daily Pivot Point S3 1.0619
Daily Pivot Point R1 1.0926
Daily Pivot Point R2 1.0996
Daily Pivot Point R3 1.1079


Share: Feed news

Information on these pages contains forward-looking statements that involve risks and uncertainties. Markets and instruments profiled on this page are for informational purposes only and should not in any way come across as a recommendation to buy or sell in these assets. You should do your own thorough research before making any investment decisions. FXStreet does not in any way guarantee that this information is free from mistakes, errors, or material misstatements. It also does not guarantee that this information is of a timely nature. Investing in Open Markets involves a great deal of risk, including the loss of all or a portion of your investment, as well as emotional distress. All risks, losses and costs associated with investing, including total loss of principal, are your responsibility. The views and opinions expressed in this article are those of the authors and do not necessarily reflect the official policy or position of FXStreet nor its advertisers. The author will not be held responsible for information that is found at the end of links posted on this page.

If not otherwise explicitly mentioned in the body of the article, at the time of writing, the author has no position in any stock mentioned in this article and no business relationship with any company mentioned. The author has not received compensation for writing this article, other than from FXStreet.

FXStreet and the author do not provide personalized recommendations. The author makes no representations as to the accuracy, completeness, or suitability of this information. FXStreet and the author will not be liable for any errors, omissions or any losses, injuries or damages arising from this information and its display or use. Errors and omissions excepted.

The author and FXStreet are not registered investment advisors and nothing in this article is intended to be investment advice.

Recommended content


Recommended content

Editors’ Picks

EUR/USD clings to daily gains above 1.0650

EUR/USD clings to daily gains above 1.0650

EUR/USD gained traction and turned positive on the day above 1.0650. The improvement seen in risk mood following the earlier flight to safety weighs on the US Dollar ahead of the weekend and helps the pair push higher.

EUR/USD News

GBP/USD recovers toward 1.2450 after UK Retail Sales data

GBP/USD recovers toward 1.2450 after UK Retail Sales data

GBP/USD reversed its direction and advanced to the 1.2450 area after touching a fresh multi-month low below 1.2400 in the Asian session. The positive shift seen in risk mood on easing fears over a deepening Iran-Israel conflict supports the pair.

GBP/USD News

Gold holds steady at around $2,380 following earlier spike

Gold holds steady at around $2,380 following earlier spike

Gold stabilized near $2,380 after spiking above $2,400 with the immediate reaction to reports of Israel striking Iran. Meanwhile, the pullback seen in the US Treasury bond yields helps XAU/USD hold its ground.

Gold News

Bitcoin Weekly Forecast: BTC post-halving rally could be partially priced in Premium

Bitcoin Weekly Forecast: BTC post-halving rally could be partially priced in

Bitcoin price shows no signs of directional bias while it holds above  $60,000. The fourth BTC halving is partially priced in, according to Deutsche Bank’s research. 

Read more

Week ahead – US GDP and BoJ decision on top of next week’s agenda

Week ahead – US GDP and BoJ decision on top of next week’s agenda

US GDP, core PCE and PMIs the next tests for the Dollar. Investors await BoJ for guidance about next rate hike. EU and UK PMIs, as well as Australian CPIs also on tap.

Read more

Forex MAJORS

Cryptocurrencies

Signatures