|

EUR/USD Price Analysis: Bounces from one-month-low as doji emerges at around 1.0940s

  • EUR/USD falls to 1.0912 but rebounds before breaching 1.0900, trading at 1.0942 with a slight gain of 0.04% on Thursday.
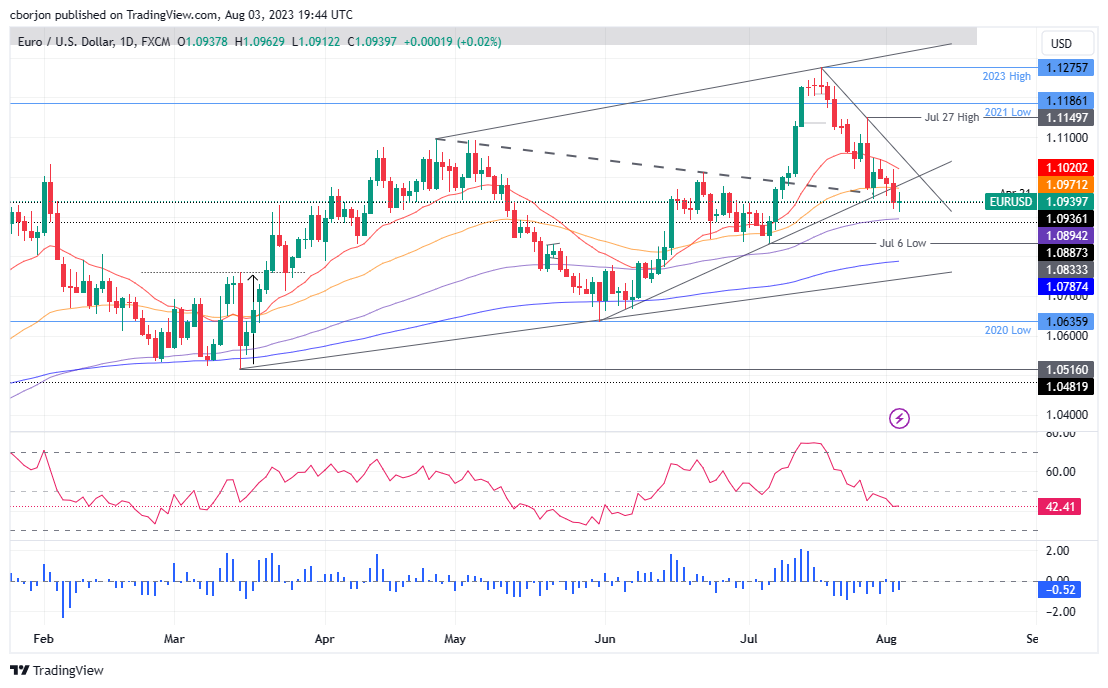
  • A potential doji formation shows market indecision; the pair might consolidate within the 1.0900/1.1000 range, with 100-day EMA at 1.0894 as a key support level.
  • Resistance lies at 1.0971 (50-day EMA), with further upside targets at 1.1000, 1.1020 (29-day EMA), and 1.1100. Conversely, a breach below the 100-day EMA could lead to further losses toward 1.0833 and 1.0800.

The EUR/USD fell to a one-month-low of 1.0912 but bounced before breaching below the 1.0900 figure and is gaining traction, as the major gains 0.04% on Thursday. Hence, the EUR/USD is trading at 1.0942, about to form a doji, which depicts indecision among buyers and sellers.

EUR/USD Price Analysis: Technical outlook

It should be said the EUR/USD dropped below the 50-day Exponential Moving Average (EMA) at 1.0871, suggesting the pair is accelerating its downtrend, but the 100-day EMA at 1.0894 capped the EUR/USD’s fall to test the July 6 swing low of 1.0833. Despite the fact that the EUR/USD’s scenario is turning bearish, the pair might consolidate within the 1.0900/1.1000 area, as a downslope trendline passes around 1.1000, while the 100-day EMA could cushion the EUR/USD around 1.0900.

However, if EUR/USD extends its losses past the latter, the 100-day EMA around 1.0894 would be tested. A breach of the latter would immediately expose the July 6 low at 1.0833, followed by the 1.0800 figure, ahead of the 200-day EMA.

Conversely, if the EUR/USD reclaims the 50-day EMA at 1.0971, the 1,1000 figure would be up for grabs. Break above would set the stage to test the 29-day EMA at 1.1020, followed by the 1.1100 mark.

Oscillator-wise, the Relative Strength Index (RSI) remains in bearish territory, but its slope is almost turning neutral. The three-day Rate of Change (RoC) portrays a positive divergence, as the RoC aims upward, while EUR/USD’s price action extends its losses. Nevertheless, a doji emerging at around 1.0900 could signal buyers to enter the market.

EUR/USD Price Action – Daily chart

EUR/USD Daily chart

EUR/USD

Overview
Today last price1.0942
Today Daily Change0.0004
Today Daily Change %0.04
Today daily open1.0938
 
Trends
Daily SMA201.1074
Daily SMA501.0926
Daily SMA1001.0913
Daily SMA2001.0734
 
Levels
Previous Daily High1.102
Previous Daily Low1.0918
Previous Weekly High1.115
Previous Weekly Low1.0944
Previous Monthly High1.1276
Previous Monthly Low1.0834
Daily Fibonacci 38.2%1.0957
Daily Fibonacci 61.8%1.0981
Daily Pivot Point S11.0898
Daily Pivot Point S21.0857
Daily Pivot Point S31.0796
Daily Pivot Point R11.1
Daily Pivot Point R21.1061
Daily Pivot Point R31.1102
 

Author

Christian Borjon Valencia

Christian Borjon began his career as a retail trader in 2010, mainly focused on technical analysis and strategies around it. He started as a swing trader, as he used to work in another industry unrelated to the financial markets.

More from Christian Borjon Valencia
Share:

Markets move fast. We move first.

Orange Juice Newsletter brings you expert driven insights - not headlines. Every day on your inbox.

By subscribing you agree to our Terms and conditions.

Editor's Picks

EUR/USD recovers to 1.1750 region as 2025 draws to a close

Following the bearish action seen in the European session on Wednesday, EUR/USD regains its traction and recovery to the 1.1750 region. Nevertheless, the pair's volatility remains low as trading conditions thin out on the last day of the year.

GBP/USD stays weak near 1.3450 on modest USD recovery

GBP/USD remains under modest beairsh pressure and fluctuates at around 1.3450 on Wednesday. The US Dollar finds fresh demand due to the end-of-the-year position adjustments, weighing on the pair amid the pre-New Year trading lull. 

Gold retreats to $4,300 area, looks to post monthly gains

Gold stays on the back foot on the last day of 2025 and trades near $4,300, possibly pressured by profit-taking and position adjustments. Nevertheless, XAU/USD remains on track to post gains for December and extend its winning streak into a fifth consecutive month.

Bitcoin, Ethereum and XRP prepare for a potential New Year rebound

Bitcoin, Ethereum, and Ripple are holding steady on Wednesday after recording minor gains on the previous day. Technically, Bitcoin could extend gains within a triangle pattern while Ethereum and Ripple face critical overhead resistance. 

Economic outlook 2026-2027 in advanced countries: Solidity test

After a year marked by global economic resilience and ending on a note of optimism, 2026 looks promising and could be a year of solid economic performance. In our baseline scenario, we expect most of the supportive factors at work in 2025 to continue to play a role in 2026.

Crypto market outlook for 2026

Year 2025 was volatile, as crypto often is.  Among positive catalysts were favourable regulatory changes in the U.S., rise of Digital Asset Treasuries (DAT), adoption of AI and tokenization of Real-World-Assets (RWA).