EUR/USD Price Analysis: Bears have a bumpy road beyond 0.9860


  • EUR/USD takes offers to attack fortnight-old horizontal support comprising yearly low.
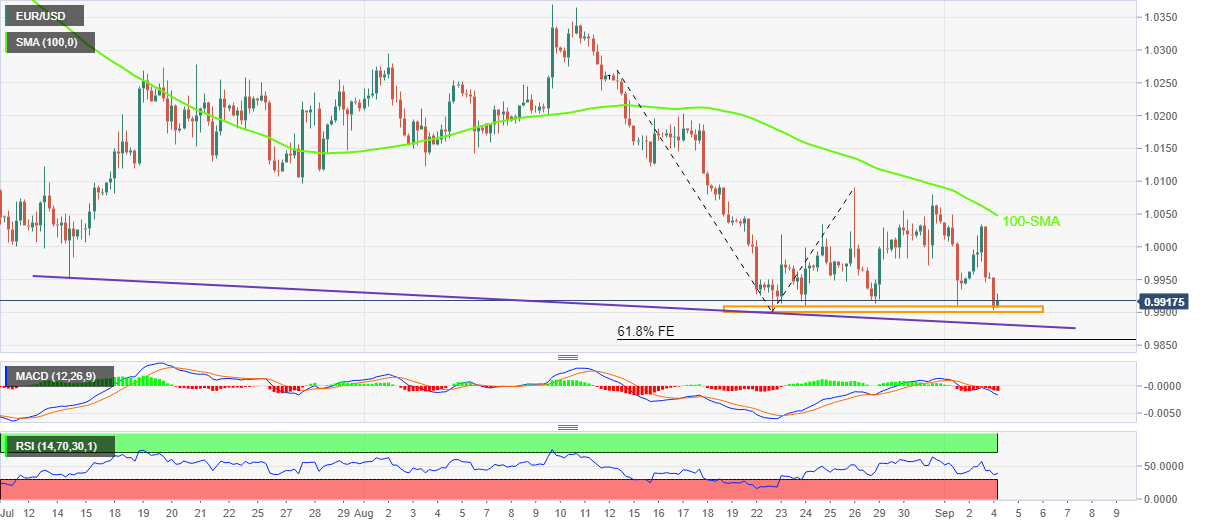
  • Descending trend line from mid-July, 61.8% FE also challenge the bears.
  • Bulls need validation from 100-SMA to retake control.

EUR/USD sellers flirt with the yearly low surrounding the 0.9900 threshold amid mixed concerns and the US Labor Day holiday on Monday. That said, the major currency pair seesaws around 0.9915-20 during the Asian session.

A two-week-old horizontal support area near 0.9910-9900 appears the tough nut to crack for the pair sellers even as the bearish MACD signals hint at the further downside. Also favoring the quote’s south-run is the descending RSI (14) line, not oversold.

It should, however, be noted that the downside break of the 0.9900 round figure won’t be enough to please the EUR/USD bears as a descending support line from mid-July, near 0.9880 could challenge the pair’s additional south-run.

Even if the quote drops below 0.9880, the likely oversold RSI conditions at that point could join the 61.8% Fibonacci Expansion (FE) of August 15-26 moves, near 0.9860, to restrict the pair’s further weakness.

In a case where EUR/USD breaks the 0.9860 support, it becomes vulnerable to testing the October 2002 lows near 0.9685.

Alternatively, recovery remains elusive until crossing the 100-SMA hurdle surrounding 1.0050.

Following that, the late July swing low near 1.0100 could test the EUR/USD upside before giving control to the bulls.

EUR/USD: Four-hour chart

Trend: Limited downside expected

Additional important levels

Overview
Today last price 0.9918
Today Daily Change -0.0035
Today Daily Change % -0.35%
Today daily open 0.9953
 
Trends
Daily SMA20 1.0086
Daily SMA50 1.0172
Daily SMA100 1.0388
Daily SMA200 1.0796
 
Levels
Previous Daily High 1.0034
Previous Daily Low 0.9943
Previous Weekly High 1.0079
Previous Weekly Low 0.9911
Previous Monthly High 1.0369
Previous Monthly Low 0.9901
Daily Fibonacci 38.2% 0.9999
Daily Fibonacci 61.8% 0.9978
Daily Pivot Point S1 0.9919
Daily Pivot Point S2 0.9886
Daily Pivot Point S3 0.9828
Daily Pivot Point R1 1.001
Daily Pivot Point R2 1.0067
Daily Pivot Point R3 1.0101


Share: Feed news

Information on these pages contains forward-looking statements that involve risks and uncertainties. Markets and instruments profiled on this page are for informational purposes only and should not in any way come across as a recommendation to buy or sell in these assets. You should do your own thorough research before making any investment decisions. FXStreet does not in any way guarantee that this information is free from mistakes, errors, or material misstatements. It also does not guarantee that this information is of a timely nature. Investing in Open Markets involves a great deal of risk, including the loss of all or a portion of your investment, as well as emotional distress. All risks, losses and costs associated with investing, including total loss of principal, are your responsibility. The views and opinions expressed in this article are those of the authors and do not necessarily reflect the official policy or position of FXStreet nor its advertisers. The author will not be held responsible for information that is found at the end of links posted on this page.

If not otherwise explicitly mentioned in the body of the article, at the time of writing, the author has no position in any stock mentioned in this article and no business relationship with any company mentioned. The author has not received compensation for writing this article, other than from FXStreet.

FXStreet and the author do not provide personalized recommendations. The author makes no representations as to the accuracy, completeness, or suitability of this information. FXStreet and the author will not be liable for any errors, omissions or any losses, injuries or damages arising from this information and its display or use. Errors and omissions excepted.

The author and FXStreet are not registered investment advisors and nothing in this article is intended to be investment advice.

Recommended content


Recommended content

Editors’ Picks

AUD/USD risks a deeper drop in the short term

AUD/USD risks a deeper drop in the short term

AUD/USD rapidly left behind Wednesday’s decent advance and resumed its downward trend on the back of the intense buying pressure in the greenback, while mixed results from the domestic labour market report failed to lend support to AUD.

AUD/USD News

EUR/USD leaves the door open to a decline to 1.0600

EUR/USD leaves the door open to a decline to 1.0600

A decent comeback in the Greenback lured sellers back into the market, motivating EUR/USD to give away the earlier advance to weekly tops around 1.0690 and shift its attention to a potential revisit of the 1.0600 neighbourhood instead.

EUR/USD News

Gold is closely monitoring geopolitics

Gold is closely monitoring geopolitics

Gold trades in positive territory above $2,380 on Thursday. Although the benchmark 10-year US Treasury bond yield holds steady following upbeat US data, XAU/USD continues to stretch higher on growing fears over a deepening conflict in the Middle East.

Gold News

Bitcoin price shows strength as IMF attests to spread and intensity of BTC transactions ahead of halving

Bitcoin price shows strength as IMF attests to spread and intensity of BTC transactions ahead of halving

Bitcoin (BTC) price is borderline strong and weak with the brunt of the weakness being felt by altcoins. Regarding strength, it continues to close above the $60,000 threshold for seven weeks in a row.

Read more

Is the Biden administration trying to destroy the Dollar?

Is the Biden administration trying to destroy the Dollar?

Confidence in Western financial markets has already been shaken enough by the 20% devaluation of the dollar over the last few years. But now the European Commission wants to hand Ukraine $300 billion seized from Russia.

Read more

Forex MAJORS

Cryptocurrencies

Signatures