|

EUR/USD Price Analysis: A move to 1.1640 is not ruled out

  • EUR/USD adds to recent gains and surpasses 1.1600.
  • Further up is located the monthly high at 1.1640.

EUR/USD advances for the second straight session and leaves behind the key 1.1600 barrier on Thursday.

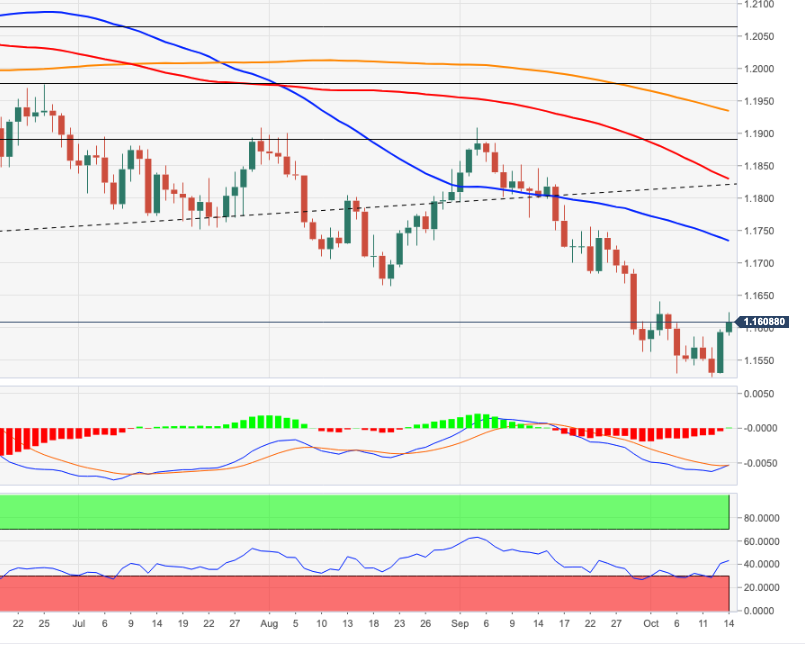
Further recovery is expected to meet the interim hurdle at the 20-day SMA at 1.1631 ahead of the monthly peak at 1.1640 (October 4). The break above this area should meet the next target at the 55-day SMA, today at 1.1732 followed by the late-September tops in the mid-1.1700s.

In the meantime, the near-term outlook for EUR/USD is seen on the negative side below the key 200-day SMA, today at 1.1932.

EUR/USD daily chart
EUR/USD

Overview
Today last price1.1614
Today Daily Change37
Today Daily Change %0.18
Today daily open1.1593
 
Trends
Daily SMA201.1641
Daily SMA501.1727
Daily SMA1001.1836
Daily SMA2001.1939
 
Levels
Previous Daily High1.1597
Previous Daily Low1.1529
Previous Weekly High1.164
Previous Weekly Low1.1529
Previous Monthly High1.1909
Previous Monthly Low1.1563
Daily Fibonacci 38.2%1.1571
Daily Fibonacci 61.8%1.1555
Daily Pivot Point S11.1549
Daily Pivot Point S21.1505
Daily Pivot Point S31.1481
Daily Pivot Point R11.1617
Daily Pivot Point R21.1642
Daily Pivot Point R31.1686

Author

Pablo Piovano

Born and bred in Argentina, Pablo has been carrying on with his passion for FX markets and trading since his first college years.

More from Pablo Piovano

Share:

Editor's Picks

AUD/USD breaks 0.7000 as RBA inflation warning fuels two-week high

The Australian Dollar registers solid gains versus the Greenback, climbing above 0.7000 and hitting a two-week high of 0.7017 as broad US Dollar weakness pushes AUD/USD above 0.7000 amid a light economic docket in both Australia and the US.

USD/JPY flatlines near 158.50 as markets seek direction

USD/JPY steadies around 158.50 in the Asian trading hours on Tuesday. Traders prefer to wait on the sidelines ahead of Japan’s National Consumer Price Index inflation data later on Friday. Meanwhile, elevated US bond yields provide some support to the US Dollar against the Japanese Yen.

Gold just failed at $4,150. This is the next stop

Gold prices trade without a clear direction on Tuesday, hovering around the $4,170 region per troy ounce and still struggling to regain upside traction following Monday’s pullback. In the meantime, lower US Treasury yields and a marked pullback in the US Dollar come in tandem with the yellow metal’s price action.

 Bitcoin resumes Nasdaq correlation as macro pressures threaten $82,500 support

Bitcoin's (BTC) correlation with the Nasdaq is rising again after last week's decline alongside tech stocks, even as macro pressures place the $82,500 support at risk. In a report on Tuesday, K33 Research highlighted that Bitcoin has resumed its correlation with the tech-heavy Nasdaq after last week's price movements.

SpaceX's earnings don't matter. What they unlock does

The Elon Musk-founded SpaceX reports third-quarter results after Tuesday's session. The figure that decides the next month for the stock isn't in them. On Thursday, the second full trading day after the release, up to 1.3 billion shares held by employees and early investors become eligible for sale.

The US Dollar fell. Gold didn't rally. That tells you everything
Gold (XAU/USD) is struggling to capitalize on a weaker US Dollar (USD), after repeatedly failing to establish itself above the $4,200 level. The precious metal remains confined to a relatively narrow trading range despite a combination of developments that would normally support higher prices.