EUR/USD picks up from lows ahead of US PCE Price Index, Q3 GDP numbers
- EUR/USD returns to levels past 1.1700 after bouncing from Wednesday's lows at 1.1670.
- Trump's Davos speech, with a softer tone towards Europe, has eased the "Sell America" trade.
- The US PCE Prices Index and the GDP figures might drive the US Dollar later on Thursday.

EUR/USD posts marginal gains on Thursday, trading right above 1.1700 at the time of writing, after bouncing from lows at the 1.1670 area. The common currency extended its reversal from 1.1770 highs on Wednesday, as US President Donald Trump toned down his threats against its European partners at the World Economic Forum in Davos, triggering a relief rally and allowing the US Dollar to regain some of the ground lost earlier this week.
Trump stepped back on his threat to impose tariffs on European countries opposing his plans to annex Greenland and ruled out military action to take the island. Later on, he announced the framework of a deal with NATO on his social media account. The US president did not provide any details of the agreement, but the announcement helped ease tensions with Europe.
As some calm returns to the markets, investors will shift their focus back to the macroeconomic data domain, where the US Personal Consumption Expenditures (PCE) Price Index and the Q3 Gross Domestic Product (GDP) figures might provide further insight into the path of the US Federal Reserve's (Fed) monetary policy.
Euro Price Today
The table below shows the percentage change of Euro (EUR) against listed major currencies today. Euro was the strongest against the Japanese Yen.
| USD | EUR | GBP | JPY | CAD | AUD | NZD | CHF | |
|---|---|---|---|---|---|---|---|---|
| USD | -0.07% | 0.00% | 0.21% | -0.06% | -0.62% | -0.50% | -0.28% | |
| EUR | 0.07% | 0.09% | 0.26% | 0.02% | -0.54% | -0.43% | -0.20% | |
| GBP | -0.00% | -0.09% | 0.15% | -0.07% | -0.63% | -0.51% | -0.29% | |
| JPY | -0.21% | -0.26% | -0.15% | -0.24% | -0.79% | -0.70% | -0.46% | |
| CAD | 0.06% | -0.02% | 0.07% | 0.24% | -0.55% | -0.44% | -0.22% | |
| AUD | 0.62% | 0.54% | 0.63% | 0.79% | 0.55% | 0.13% | 0.33% | |
| NZD | 0.50% | 0.43% | 0.51% | 0.70% | 0.44% | -0.13% | 0.22% | |
| CHF | 0.28% | 0.20% | 0.29% | 0.46% | 0.22% | -0.33% | -0.22% |
The heat map shows percentage changes of major currencies against each other. The base currency is picked from the left column, while the quote currency is picked from the top row. For example, if you pick the Euro from the left column and move along the horizontal line to the US Dollar, the percentage change displayed in the box will represent EUR (base)/USD (quote).
Daily Digest Market Movers: US Dollar bounces up as Trump eases tensions with Europe
- Trump has taken off the table the option of a military confrontation between NATO members and the threat of additional tariffs on EU countries, and the market has sighed with relief. The US Dollar has regained some ground lost in previous days, and the Euro has pulled back.
- The transatlantic relationship is still far from its best moment, though. ECB President Christine Lagarde walked out abruptly of an invitation-only dinner – hosted by BlackRock CEO Larry Fink at Davos – after US Commerce Secretary Howard Lutnick criticized the European Union during a speech.
- The European Central Bank's (ECB Monetary Policy Meeting Accounts, released earlier on Thursday, revealed that economic growth was proving more resilient than previously thought but that the recovery remains fragile. ECB policymakers also considered that inflation remains in a good place, altogether hinting at steady interest rates for the foreseeable future.
- The focus on Thursday is on the release of the delayed US Personal Consumption Expenditures Price Indexes for October and November. PCE inflation is expected to have remained at growing levels significantly above the Fed's 2% target in November.
- Before that, the US Bureau of Economic Analysis will release the final reading of the Q3 GDP, which is expected to confirm that economic growth accelerated to 4.3% annualized, from 3.8% in the previous quarter. All in all, data reflecting healthy growth and sticky inflation levels, adding to the case of a Fed monetary pause.
Technical Analysis: EUR/USD recovery might find resistance at 1.1710
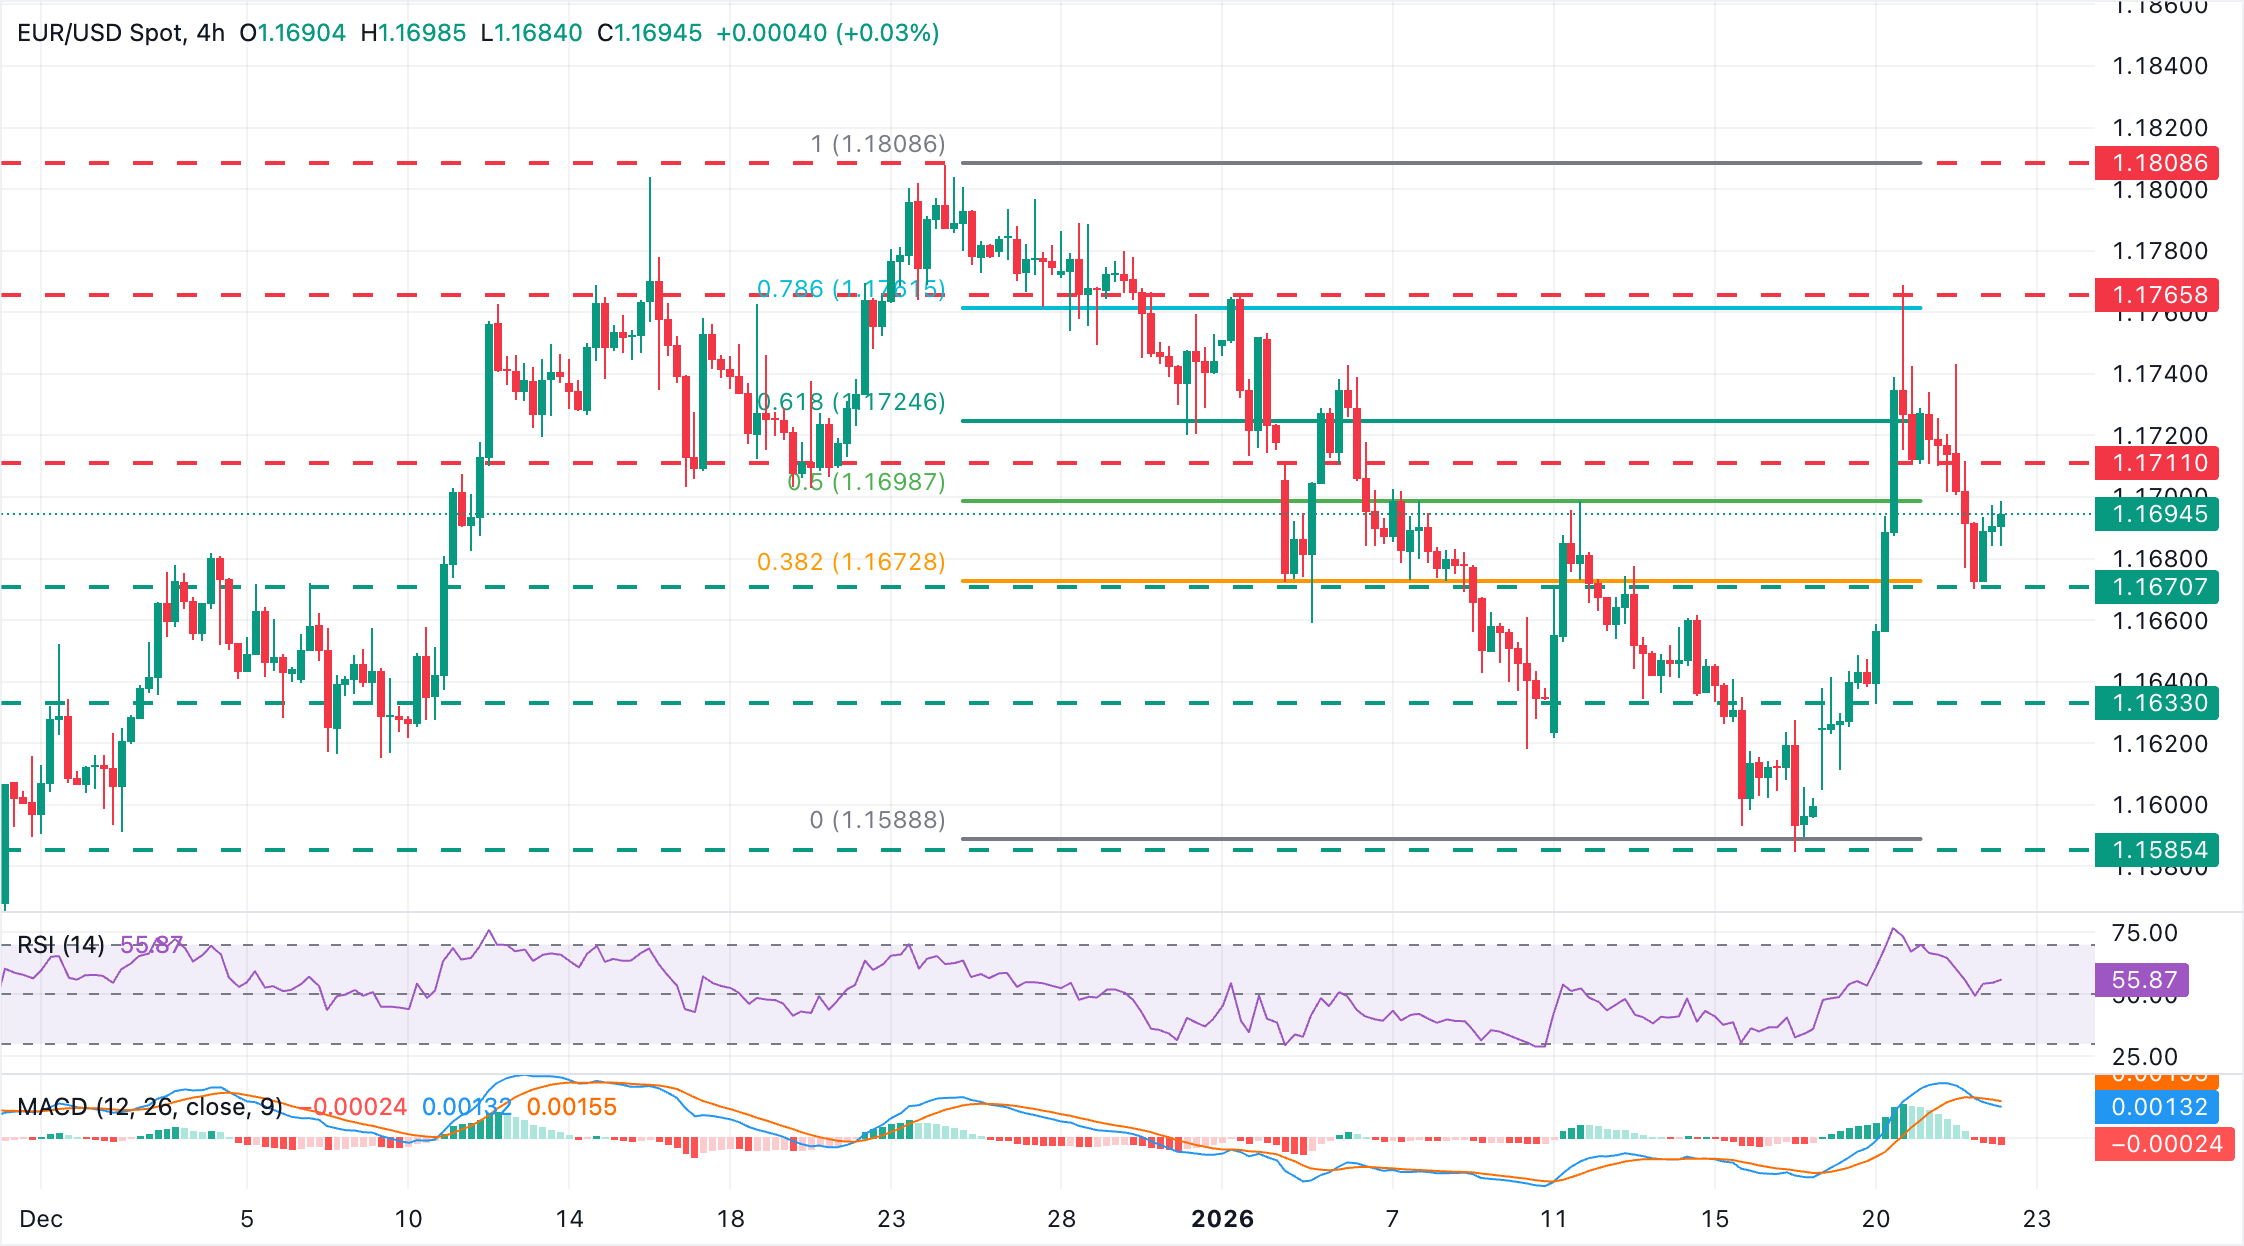
The EUR/USD recovery was capped at 1.1770, and the pair is now looking for direction, halfway through the recent range. The Moving Average Convergence Divergence (MACD) has turned marginally negative on the 4-hour chart, and the MACD line is attempting to cross below the signal line, a bearish sign. The Relative Strength Index (RSI) holds right above 50, showing a neutral level.
Bears have been contained at Wednesday's low of 1.1670, but the pair is struggling to bounce up. A break of that level would increase bearish pressure towards the intraday support in the area of 1.1630. To the upside, previous support at 1.1710 (intraday level) might offer some resistance ahead of the January 2 and 20 highs, in the area of 1.1770
(The technical analysis of this story was written with the help of an AI tool.)
Economic Indicator
Gross Domestic Product Annualized
The real Gross Domestic Product (GDP) Annualized, released quarterly by the US Bureau of Economic Analysis, measures the value of the final goods and services produced in the United States in a given period of time. Changes in GDP are the most popular indicator of the nation’s overall economic health. The data is expressed at an annualized rate, which means that the rate has been adjusted to reflect the amount GDP would have changed over a year’s time, had it continued to grow at that specific rate. Generally speaking, a high reading is seen as bullish for the US Dollar (USD), while a low reading is seen as bearish.
Read more.Next release: Thu Jan 22, 2026 13:30
Frequency: Quarterly
Consensus: 4.3%
Previous: 4.3%
Source: US Bureau of Economic Analysis
The US Bureau of Economic Analysis (BEA) releases the Gross Domestic Product (GDP) growth on an annualized basis for each quarter. After publishing the first estimate, the BEA revises the data two more times, with the third release representing the final reading. Usually, the first estimate is the main market mover and a positive surprise is seen as a USD-positive development while a disappointing print is likely to weigh on the greenback. Market participants usually dismiss the second and third releases as they are generally not significant enough to meaningfully alter the growth picture.
Economic Indicator
Personal Consumption Expenditures - Price Index (YoY)
The Personal Consumption Expenditures (PCE), released by the US Bureau of Economic Analysis on a monthly basis, measures the changes in the prices of goods and services purchased by consumers in the United States (US). The YoY reading compares prices in the reference month to a year earlier. Price changes may cause consumers to switch from buying one good to another and the PCE Deflator can account for such substitutions. This makes it the preferred measure of inflation for the Federal Reserve. Generally, a high reading is bullish for the US Dollar (USD), while a low reading is bearish.
Read more.Next release: Thu Jan 22, 2026 15:00
Frequency: Monthly
Consensus: -
Previous: 2.8%
Source: US Bureau of Economic Analysis
Author

Guillermo Alcala
FXStreet
Graduated in Communication Sciences at the Universidad del Pais Vasco and Universiteit van Amsterdam, Guillermo has been working as financial news editor and copywriter in diverse Forex-related firms, like FXStreet and Kantox.


