|

EUR/USD ends Thursday where it starts, recovering into 1.0660 after Fed-inspired backslide

  • EUR/USD slips on hawkish Fed but recovers Thursday to end the day flat.
  • Fed sees rates higher and longer, sending US Dollar up across the board.
  • PMI figures to cap off the economic calendar for the trading week.

The EUR/USD slid further down the charts on Thursday, testing into new six-month lows near 1.0617 before recovering from the bottom to close out the day near 1.0660 and now heads into the Friday market session with the Greenback (USD) taking a step back.

The Federal Reserve held benchmark interest rates at 5.5% as markets broadly expected on Wednesday, but the US central bank is seeing interest rates holding higher for longer than previously anticipated, and the Fed now only expects interest rates to cut by half a percent by the end of 2024.

Fed sees a longer rate cut schedule, bolstering US Dollar

With the hawkish outlook in the books, US equities declined and US Treasury yields spiked higher, sending the US Dollar index higher across the entire global currency space, and the Euro fell to a new low.

The EUR/USD pair is already decidedly bearish, having closed in the red for the past nine consecutive weeks. This week will only break the near-term trend if markets are able to push the Euro higher and hold ground before Friday's closing bell.

Friday's Purchasing Manager Index (PMI) figures are expected to twist, with the EU forecast to see a slight decline and a minor uptick in US numbers.

European PMI composite is slated to come in at 46.5 versus the previous 46.7, while the US side sees manufacturing rising from 57.9 to an even 48, and the services PMI component lifting from 50.5 to 50.6.

EUR/USD technical outlook

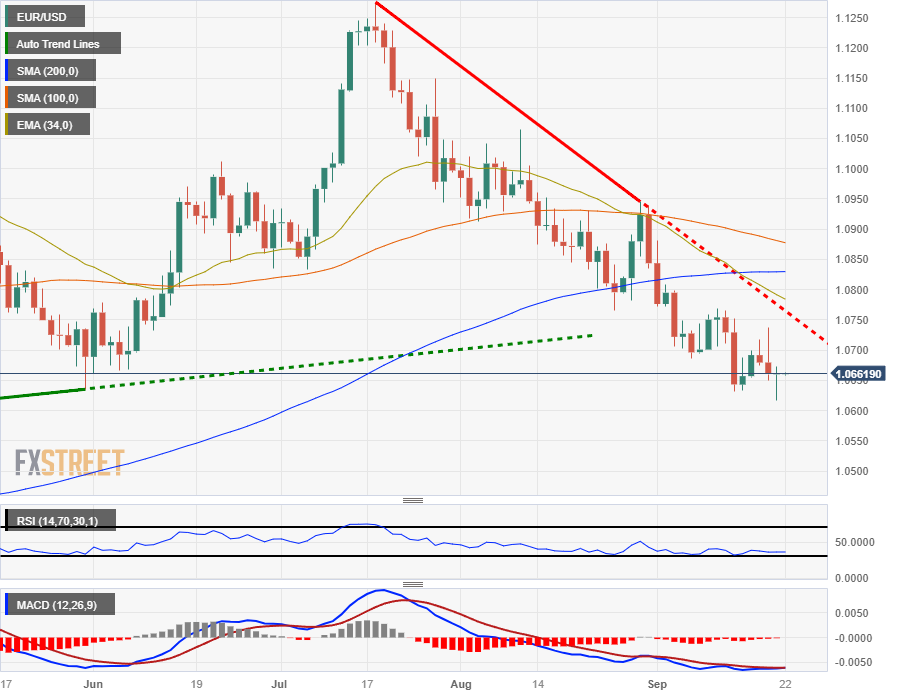
The EUR/USD is currently trapped into the 34-hour Exponential Moving Average (EMA), and sitting on the bearish side of the 200-hour Simple Moving Average (SMA) currently parked just north of 1.0690.

The Euro is rising from Thursday's low of 1.0620, but the pair is still significantly off Wednesday's peak at 1.0737.

On the daily charts, the EUR/USD spun out a hammer candlestick, and technical indicators are starting to flash oversold conditions.

The Relative Strength Index (RSI) and Moving Average Convergence-Divergence (MACD) indicators are on the low end and threatening to turn bullish, and a recovery from here could see the EUR/USD set to make another challenge run at the descending trendline from July's swing high into 1.1250.

EUR/USD daily chart

EUR/USD technical levels

EUR/USD

Overview
Today last price1.0662
Today Daily Change0.0002
Today Daily Change %0.02
Today daily open1.066
 
Trends
Daily SMA201.0753
Daily SMA501.0908
Daily SMA1001.0885
Daily SMA2001.0829
 
Levels
Previous Daily High1.0737
Previous Daily Low1.065
Previous Weekly High1.0769
Previous Weekly Low1.0632
Previous Monthly High1.1065
Previous Monthly Low1.0766
Daily Fibonacci 38.2%1.0683
Daily Fibonacci 61.8%1.0704
Daily Pivot Point S11.0628
Daily Pivot Point S21.0596
Daily Pivot Point S31.0541
Daily Pivot Point R11.0715
Daily Pivot Point R21.0769
Daily Pivot Point R31.0802

Author

Joshua Gibson

Joshua joins the FXStreet team as an Economics and Finance double major from Vancouver Island University with twelve years' experience as an independent trader focusing on technical analysis.

More from Joshua Gibson
Share:

Markets move fast. We move first.

Orange Juice Newsletter brings you expert driven insights - not headlines. Every day on your inbox.

By subscribing you agree to our Terms and conditions.

Editor's Picks

EUR/USD struggles to extend advance above 1.1800

The EUR/USD pair posts a fresh weekly low near 1.1740 during the Asian trading session on Wednesday. The major currency pair is under pressure as the US Dollar edges higher despite Federal Open Market Committee minutes of the December policy meeting, released on Tuesday, showing that most policymakers stressed the need for further interest rate cuts.

GBP/USD tests 1.3450 support after moving below nine-day EMA

GBP/USD remains subdued for the second consecutive day, trading around 1.3460 during the Asian hours on Wednesday. The technical analysis of the daily chart indicates a weakening of a bullish bias as the pair is positioned slightly below the lower boundary of the ascending channel pattern.

Gold jumps on US rate cut prospects, safe-haven demand

Gold price extends the rally above $4,350 during the early European trading hours on Wednesday. Gold's price has surged about 65% this year and is set to record its biggest annual gains since 1979. The rally in the precious metal is bolstered by the prospect of further US interest rate cuts in 2026. Lower interest rates could reduce the opportunity cost of holding Gold, supporting the non-yielding precious metal.

Bitcoin, Ethereum and XRP prepare for a potential New Year rebound

Bitcoin, Ethereum, and Ripple are holding steady on Wednesday after recording minor gains on the previous day. Technically, Bitcoin could extend gains within a triangle pattern while Ethereum and Ripple face critical overhead resistance. 

Economic outlook 2026-2027 in advanced countries: Solidity test

After a year marked by global economic resilience and ending on a note of optimism, 2026 looks promising and could be a year of solid economic performance. In our baseline scenario, we expect most of the supportive factors at work in 2025 to continue to play a role in 2026.

Crypto market outlook for 2026

Year 2025 was volatile, as crypto often is.  Among positive catalysts were favourable regulatory changes in the U.S., rise of Digital Asset Treasuries (DAT), adoption of AI and tokenization of Real-World-Assets (RWA).