|

EUR/USD edges lower towards 0.9800 as US dollar firms up ahead of PMIs

  • EUR/USD looks south towards 0.9800 as US dollar bulls regain poise.
  • Treasury yields cling to recent gains hawkish Fed outlook, Powell eyed.
  • Ascending triangle breakdown on 1D suggests more declines for EUR/USD.

EUR/USD is dropping towards 0.9800 heading towards early European morning, as the US dollar is breaking its consolidative mode to the upside.

Investors gear up for a raft of preliminary PMis from across the Euro area economies and the US for fresh trading impetus, as the dust settles over the Fed aftermath. Fed Chair Jerome Powell’s speech later in the NA session will also hog the limelight, as it will be his first appearance after Wednesday’s rate hike decision.

Meanwhile, the US Treasury yields are holding onto their recent upsurge, underpinning dollar bulls while exerting downward pressure on the major. Further, the euro also remains vulnerable, in the wake of the renewed Russian aggression.

On Wednesday, Russian President Vladimir Putin announced a partial military mobilization in Ukraine, denting market sentiment and bolstering the safe-haven bids for the greenback.

The Russia-Ukraine crisis and the resultant Moscow’s gas flow cut-off to Europe has placed the old continent on brink of a recession. The upcoming Eurozone Manufacturing and Services PMIs could throw fresh light on the health of the Union.

EUR/USD: Technical outlook

Looking at EUR/USD’s daily chart, the ascending triangle breakdown confirmed, following the Fed decision on Wednesday, keeps the further downside exposed towards 0.9750 – the psychological level. But the bears need a sustained break below the 0.9800 level beforehand.

The 14-day Relative Strength Index (RSI) remains bearish while sitting just above the oversold territory, adding credence to the next leg lower.

EUR/USD: Daily chart

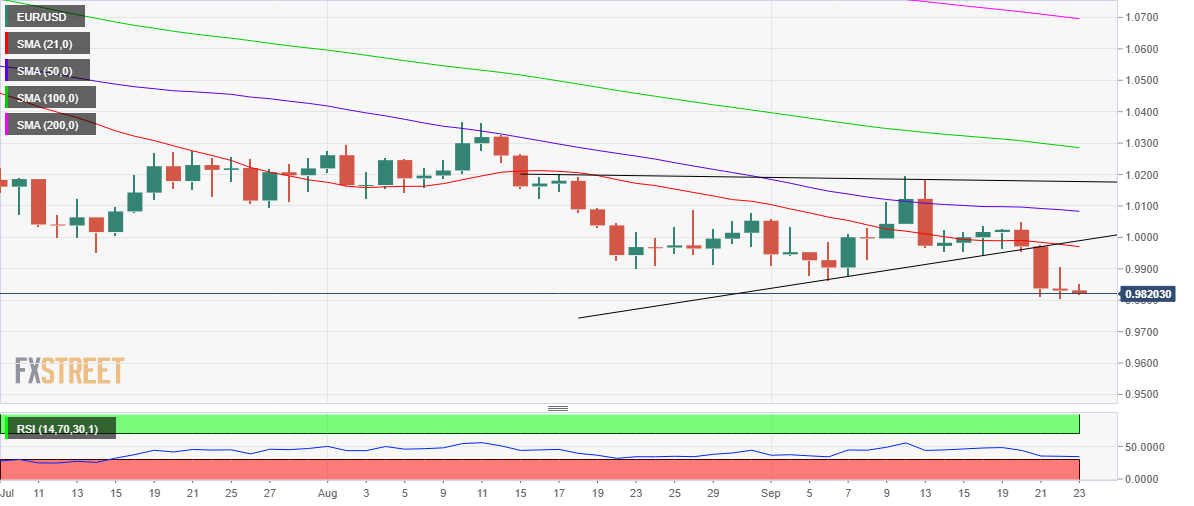
On the flip side, Thursday’s high at 0.9907 will be the first critical hurdle should the major attempt a recovery.

Further up, daily closing above the confluence of the bearish 21-Daily Moving Average (DMA) and the triangle support-turned-resistance around 0.9970 will test buyers.  

EUR/USD: Additional levels to consider

EUR/USD

Overview
Today last price0.9820
Today Daily Change-0.0010
Today Daily Change %-0.10
Today daily open0.9831
 
Trends
Daily SMA200.9978
Daily SMA501.0088
Daily SMA1001.0292
Daily SMA2001.0703
 
Levels
Previous Daily High0.9908
Previous Daily Low0.9807
Previous Weekly High1.0198
Previous Weekly Low0.9945
Previous Monthly High1.0369
Previous Monthly Low0.9901
Daily Fibonacci 38.2%0.9845
Daily Fibonacci 61.8%0.9869
Daily Pivot Point S10.9789
Daily Pivot Point S20.9748
Daily Pivot Point S30.9689
Daily Pivot Point R10.989
Daily Pivot Point R20.9949
Daily Pivot Point R30.999

Author

Dhwani Mehta

Dhwani Mehta

FXStreet

Residing in Mumbai (India), Dhwani is a Senior Analyst and Manager of the Asian session at FXStreet. She has over 10 years of experience in analyzing and covering the global financial markets, with specialization in Forex and commodities markets.

More from Dhwani Mehta
Share:

Editor's Picks

EUR/USD seems fragile below 1.1700 as Middle East war boosts energy prices

The EUR/USD pair trades flat at around 1.1680 during the Asian trading session on Tuesday, but broadly seems vulnerable, being close to its five-week low. The major currency pair is under pressure as surging oil prices due to the United States-Israel war with Iran have increased the risks of higher inflation for the Old Continent.

GBP/USD hovers around 1.3400 with bearish pressure intact

GBP/USD edges higher after three days of losses, trading around 1.3400 during the Asian hours on Tuesday. The technical analysis of the daily chart indicates an ongoing bearish bias, as the pair trades within a descending channel pattern.

Gold sticks to gains above $5,350 amid sustained safe-haven demand; firmer USD caps gains

Gold sticks to its positive bias for the third straight day and trades above the $5,350 level heading into the European session on Tuesday. Concerns about a broader regional conflict in the Middle East continue to weigh on investors' sentiment and underpin demand for the traditional safe-haven bullion.

Stellar risks deeper losses as derivatives metrics turn negative

Stellar is trading red below $0.16 at the time of writing on Tuesday, after a slight recovery the previous day. Weakening derivatives data caps the recovery, while an unfavorable technical outlook projects a deeper correction for the XLM token in the upcoming days.

The market is not panicking it is repricing the probability distribution of Oil and time

At the end of the day, markets do not trade morality or geopolitics. They trade transmission channels. And the only channel that truly matters in this maelstrom runs through the price of energy and the time value of money.

Grass 20% bullish breakout defies broader market weakness

Grass (GRASS) is edging up above $0.30 at the time of writing on Monday. The token’s notable 20% intraday surge stands out amid heightened volatility in the broader crypto market.