EUR/USD bounds higher post-NFP, taps into 1.0600
- EUR/USD catches a firm lift post-US NFP release, climbing 1.12% from the day's bottom.
- Broad-market flows have gone firmly risk-on following a bumper NFP reading for the USD.
- Euro traders will be looking ahead to Monday's investor confidence indicator for October.

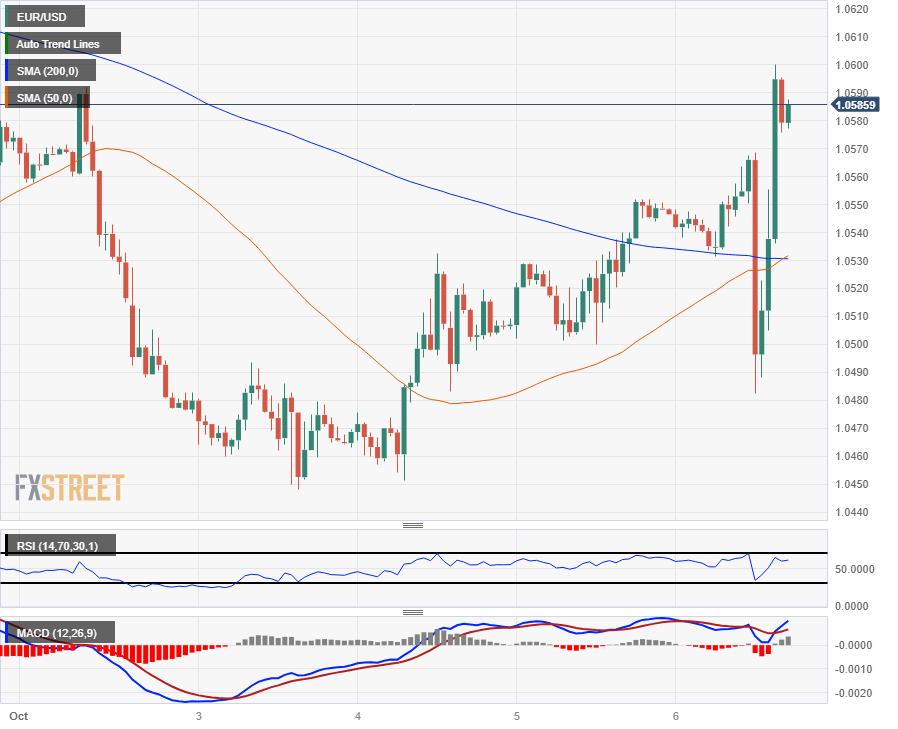
The EUR/USD climbed 117 pips from Friday's bottom bids of 1.0482 to tap into the 1.0600 handle as Friday's US Non-Farm Payrolls (NFP) sends investors piling out of the US Dollar and back into risk assets to close out the trading week. The EUR/USD is now trading back slightly, testing the waters around 1.0580 as investors settle into the Friday close.
US Nonfarm Payrolls soar by 336,000 in September vs. 170,000 forecast
The Euro (EUR) is now back into green territory for the trading week, but only just, after hitting a weekly low near 1.0448. The US added 336K jobs last month, a clean beat of the forecast 170K and a step above the previous print of 176K (revised upwards to 227K).
The economic calendar is looking notably thin for the opening half of next week, with the EU's Sentix Investor Confidence reading for October, which last printed at -21.5.
Next Wednesday will bring US Producer Price Index (PPI) figures, as well as the Federal Reserve's latest meeting minutes.
EUR/USD technical outlook
The EUR/USD is trading just south of 1.0600 after climbing from Friday's bottom, turning the trading day green and erasing the week's downside losses as Euro bulls look to keep the pair trading in positive territory into the closing bell.
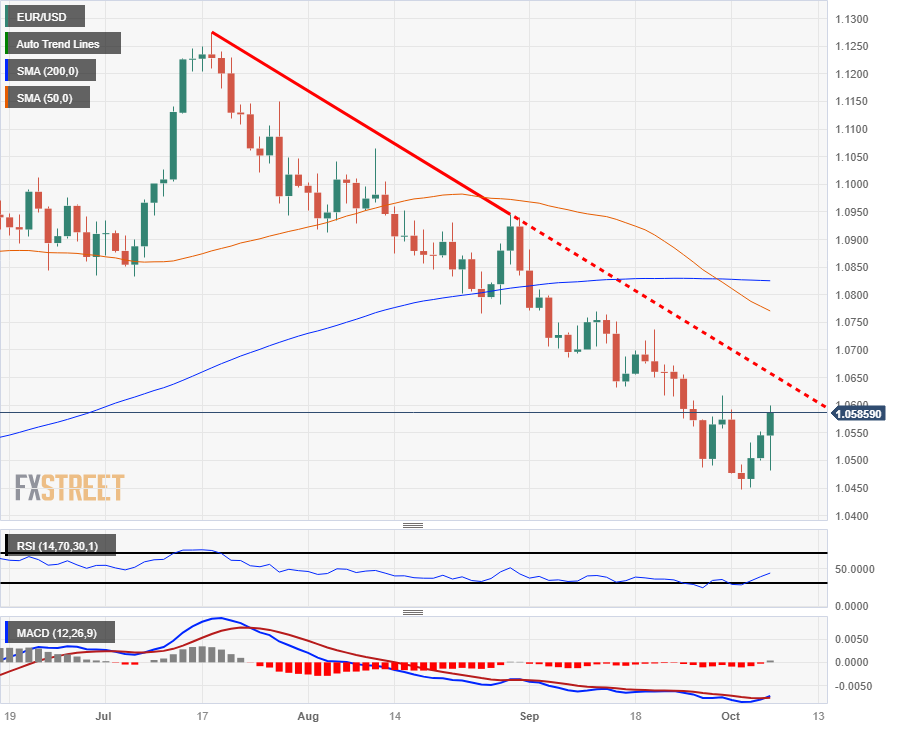
The Euro is set to close bullish against the US Dollar for the third straight trading day, but the pair remains steeply in bearish territory with daily candlesticks still trading far below the 200-day Simple Moving Average (SMA) near 1.0825.
A descending trendline from July's peak of 1.1275 remains the target to beat for bidders, and the 50-day SMA will pose an additional technical challenge as it confirms a bearish crossover of the longer moving average.
Technical indicators are moving broadly out of oversold territory, and bidders could use the reversal signals to gain a foothold into higher territory. The Relative Strength Index (RSI) and Moving Average Convergence-Divergence (MACD) indicators are both rolling over from oversold to bidding phases, giving the EUR/USD room to run if investor confidence manages to hold steady.
EUR/USD hourly chart
EUR/USD daily chart
EUR/USD technical levels
Author

Joshua Gibson
FXStreet
Joshua joins the FXStreet team as an Economics and Finance double major from Vancouver Island University with twelve years' experience as an independent trader focusing on technical analysis.