|

EUR/USD Asia Price Forecast: Euro advances to 6-day’s highs, challenges 1.1060 level

  • EUR/USD retracement up challenges the 1.1060 resistance and the 100 SMA on the four-hour chart.
  • The next levels of resistance are seen near 1.1100 and 1.1163.
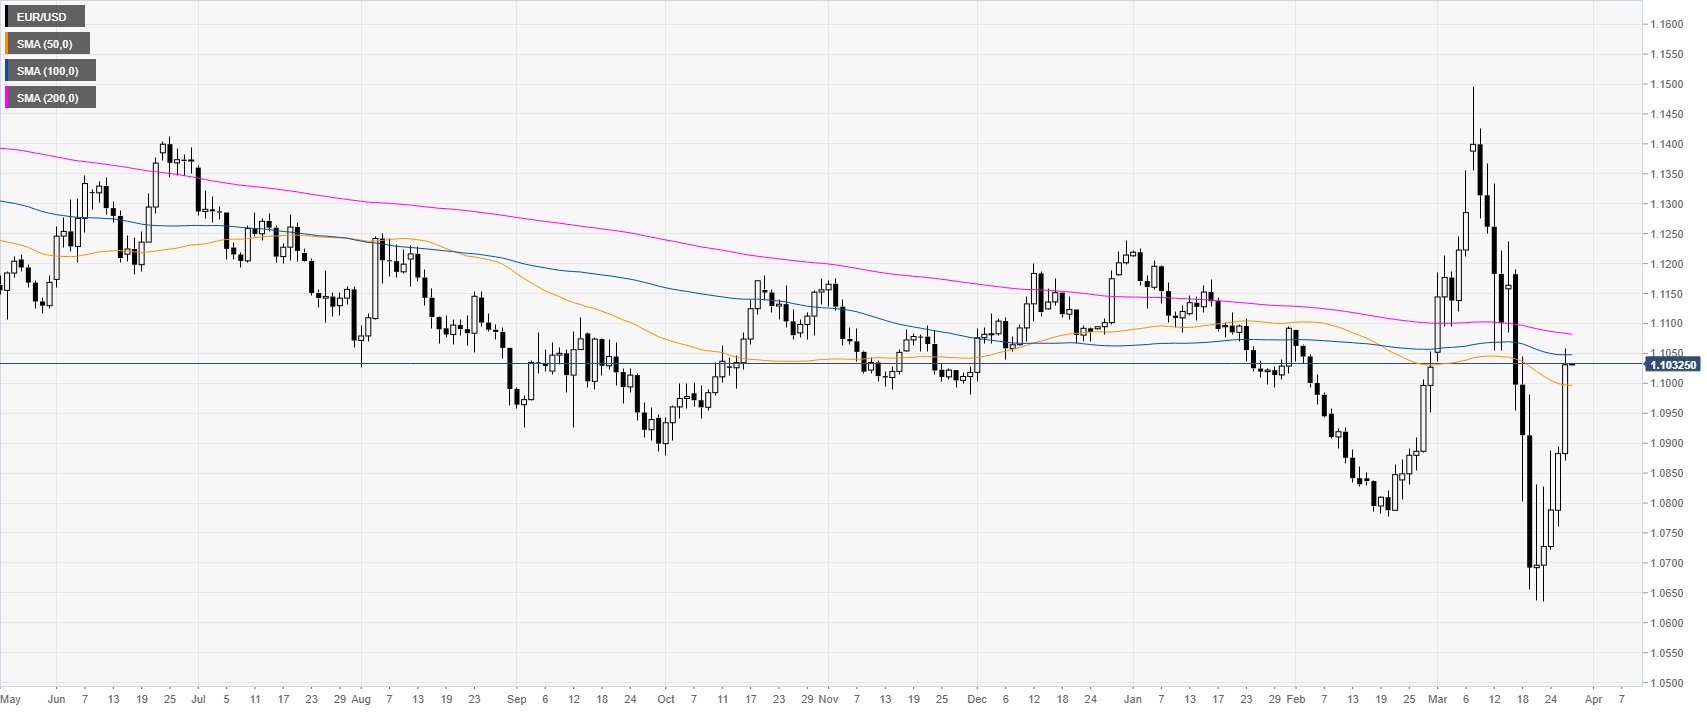
 

EUR/USD daily chart 

 
EUR/USD bounces sharply from the 2020 lows while challenging the 100 SMA on the four-hour chart. This Thursday the correction up accelerated and broke above the 1.1000 psychological level. 
 

EUR/USD four-hour chart

 
EUR/USD is challenging the 1.1060 resistance and the 100 SMA on the four-hour chart. As the market gained considerable momentum the spot could continue to trade higher towards the 1.1100 and 1.1163 price levels in the medium term while support can be expected near the 1.1014, 1.0980 and 1.0900 levels, according to the Technical Confluences Indicator.
 
 
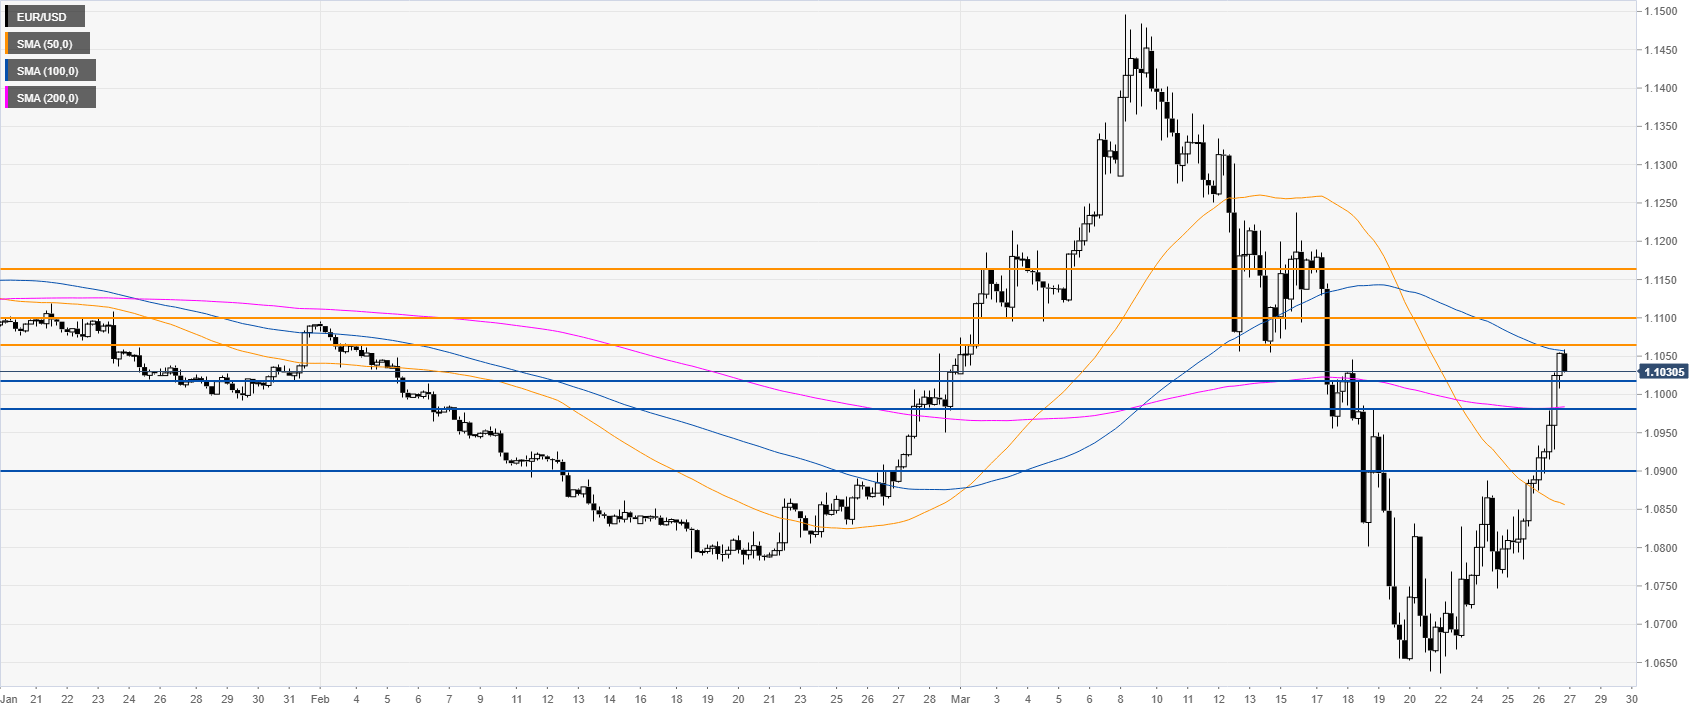
Resistance: 1.1060, 1.1100, 1.1163
Support: 1.1014, 1.0980, 1.0900


Additional key levels

EUR/USD

Overview
Today last price1.1031
Today Daily Change0.0149
Today Daily Change %1.37
Today daily open1.0882
 
Trends
Daily SMA201.1059
Daily SMA501.1001
Daily SMA1001.1048
Daily SMA2001.1085
 
Levels
Previous Daily High1.0894
Previous Daily Low1.0761
Previous Weekly High1.1237
Previous Weekly Low1.0638
Previous Monthly High1.1089
Previous Monthly Low1.0778
Daily Fibonacci 38.2%1.0843
Daily Fibonacci 61.8%1.0812
Daily Pivot Point S11.0797
Daily Pivot Point S21.0712
Daily Pivot Point S31.0664
Daily Pivot Point R11.0931
Daily Pivot Point R21.0979
Daily Pivot Point R31.1064

Author

Flavio Tosti

Flavio Tosti

Independent Analyst


More from Flavio Tosti
Share:

Editor's Picks

EUR/USD remains offered below 1.1600, seems vulnerable near multi-month low

The EUR/USD pair struggles to capitalize on the overnight bounce from the 1.1530 region, or the lowest level since November 2025, and lower for the third consecutive day on Wednesday. Spot prices slide back below the 1.1600 mark during the Asian session and seem vulnerable to slide further.

GBP/USD slips below key averages as geopolitical risks mount

GBP/USD fell about 0.35% on Tuesday, settling around 1.3350 after slipping below the 200-day Exponential Moving Average for the first time since early December. The pair has pulled back sharply from its late-January high near 1.3870, shedding over 500 pips in a series of lower highs and lower lows. 

Gold rebounds ahead of US ADP, will it last?

Gold finds renewed Asian bids and retests $5,230 early Wednesday after the heavy sell-off on Tuesday. The US Dollar stands tall amid escalating Middle East tensions and reduced dovish Fed expectations. Gold defends $5,000 or 50% Fibo level after facing rejection at the 78.6% Fibo resistance at $5,342 amid bullish RSI.  

Bitcoin, Ethereum and Ripple struggle for direction as consolidation persists

Bitcoin, Ethereum and Ripple prices trade with a cautious tone at the time of writing on Wednesday as upside momentum continues to fade across the broader crypto market. BTC remains within a parallel channel, ETH struggles below key resistance, while XRP remains fragile within a descending channel. These top three cryptocurrencies by market capitalization continue to struggle to establish a directional bias amid the consolidation phase.

Energy shock 2.0: Why rising Gas prices could hit the Euro

Even without a confirmed, sustained disruption, the mere risk to a key global energy chokepoint is enough to inject a significant premium into European Gas markets. And for the Euro, that matters.

Ripple falters amid sell-off jitters and negative funding rates

Ripple (XRP) has come under pressure, drifting lower to $1.35 at the time of writing on Tuesday. The over 2% correction looks poised to erase the previous day’s gains, which lifted the remittance token to $1.42.