EUR/NOK clinches weekly tops around 10.1300
- EUR/NOK adds to recent gains near 10.1300 on Friday.
- NOK eases further ground on lower Brent crude prices.
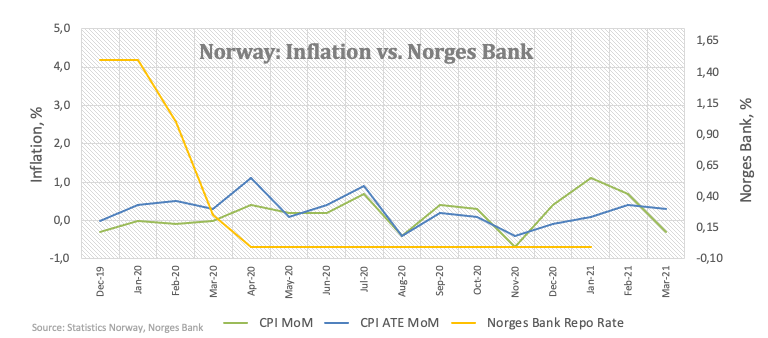
- Norway’s March CPI contracted 0.3% MoM, rose 3.1% YoY.

The Norwegian krone depreciates further and pushes EUR/NOK to new weekly tops in the 10.1300 region on Friday.
EUR/NOK up on oil weakness
EUR/NOK advances for the second session in a row at the end of the week, as the Norwegian currency tracks the corrective downside in prices of the European reference Brent crude, which is hovering around the $63.00 mark per barrel.
NOK also saw its selling sentiment exacerbated after inflation figures came in on the soft side during March. In fact, the headline CPI contracted at a monthly 0.3% and rose 3.1% over the last twelve months. The more relevant CPI-ATE (CPI adjusted for tax and excluding energy costs) rose 0.3% inter-month and 2.7% from a year earlier.
The CPI-ATE is the preferred gauge of inflation for the Norges Bank in its policy setting measures and it has been running above the bank’s target for the fifteenth month in a row. It is worth recalling that the Norges Bank is expected to hike rates at some point in the second half of the year (probably in September).
What to look for around NOK
NOK now puts some distance from the psychological 10.00 barrier, always following Brent dynamics and the hawkish stance from the Norges Bank. That, coupled with a faster economic recovery, the firm vaccine rollout and prospects of a solid rebound in the global activity are seen collaborating with the view of a stronger currency in the medium-term. It is worth recalling that the Norges Bank is predicted to be one of the first central banks to hike rates in the DM space.
EUR/NOK significant levels
As of writing the cross is up 0.40% at 10.1115 and faces the next resistance at 10.1804 (50-day SMA) seconded by 10.2749 (weekly high Mar.24) and then 10.4826 (monthly high Feb.26). On the other hand, a breach of 10.0032 (2021 low Mar.11) would expose 9.8163 (2020 low Jan.2) and finally 9.5552 (2019 low Apr.22).
Author

Pablo Piovano
FXStreet
Born and bred in Argentina, Pablo has been carrying on with his passion for FX markets and trading since his first college years.


