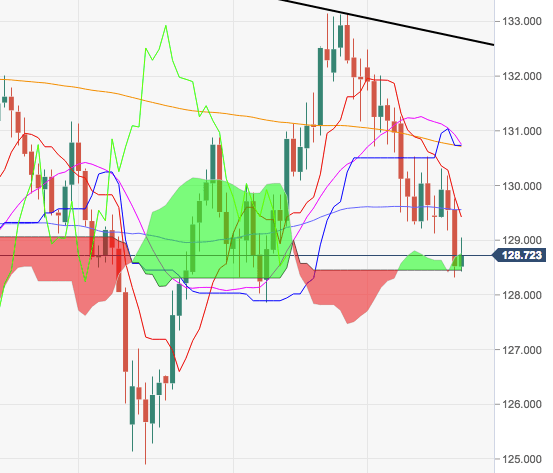
EUR/JPY Technical Analysis: The cross met support in the 128.30 region. Remains vulnerable
- The soft tone around the European currency triggered a sharp leg lower in the cross, forcing it to drop as low as the 128.30 area, or multi-week lows, on Thursday.
- A deeper retracement should see September’s low at 127.86 revisited. This is considered the latest defense of a test of 124.88, August’s low.
- On the upside, immediate hurdle emerges in the mid-129.00s, a key area where converge the 10-, 100- and 55-day SMAs.

EUR/JPY daily chart
EUR/JPY
Overview:
Last Price: 128.72
Daily change: 20 pips
Daily change: 0.156%
Daily Open: 128.52
Trends:
Daily SMA20: 130.85
Daily SMA50: 129.64
Daily SMA100: 129.51
Daily SMA200: 130.75
Levels:
Daily High: 129.76
Daily Low: 128.32
Weekly High: 131.26
Weekly Low: 129.21
Monthly High: 133.15
Monthly Low: 127.87
Daily Fibonacci 38.2%: 128.87
Daily Fibonacci 61.8%: 129.21
Daily Pivot Point S1: 127.98
Daily Pivot Point S2: 127.44
Daily Pivot Point S3: 126.55
Daily Pivot Point R1: 129.41
Daily Pivot Point R2: 130.3
Daily Pivot Point R3: 130.84
Author

Pablo Piovano
FXStreet
Born and bred in Argentina, Pablo has been carrying on with his passion for FX markets and trading since his first college years.


