EUR/JPY Price Prediction: Continues to pullback to trendline for Sept-Oct rally
- EUR/JPY pulls back to the trendline for the recent rally from the September lows.
- If it breaks higher it could kick-off an extension to a target in the 169s, MACD is bearish, however.

EUR/JPY continues its pullback to the trendline (dashed line on chart) for the September-October rally.
The pair is in a short and medium-term uptrend which given the technical analysis maxim that “the trend is your friend” is favored to continue higher.
EUR/JPY Daily Chart
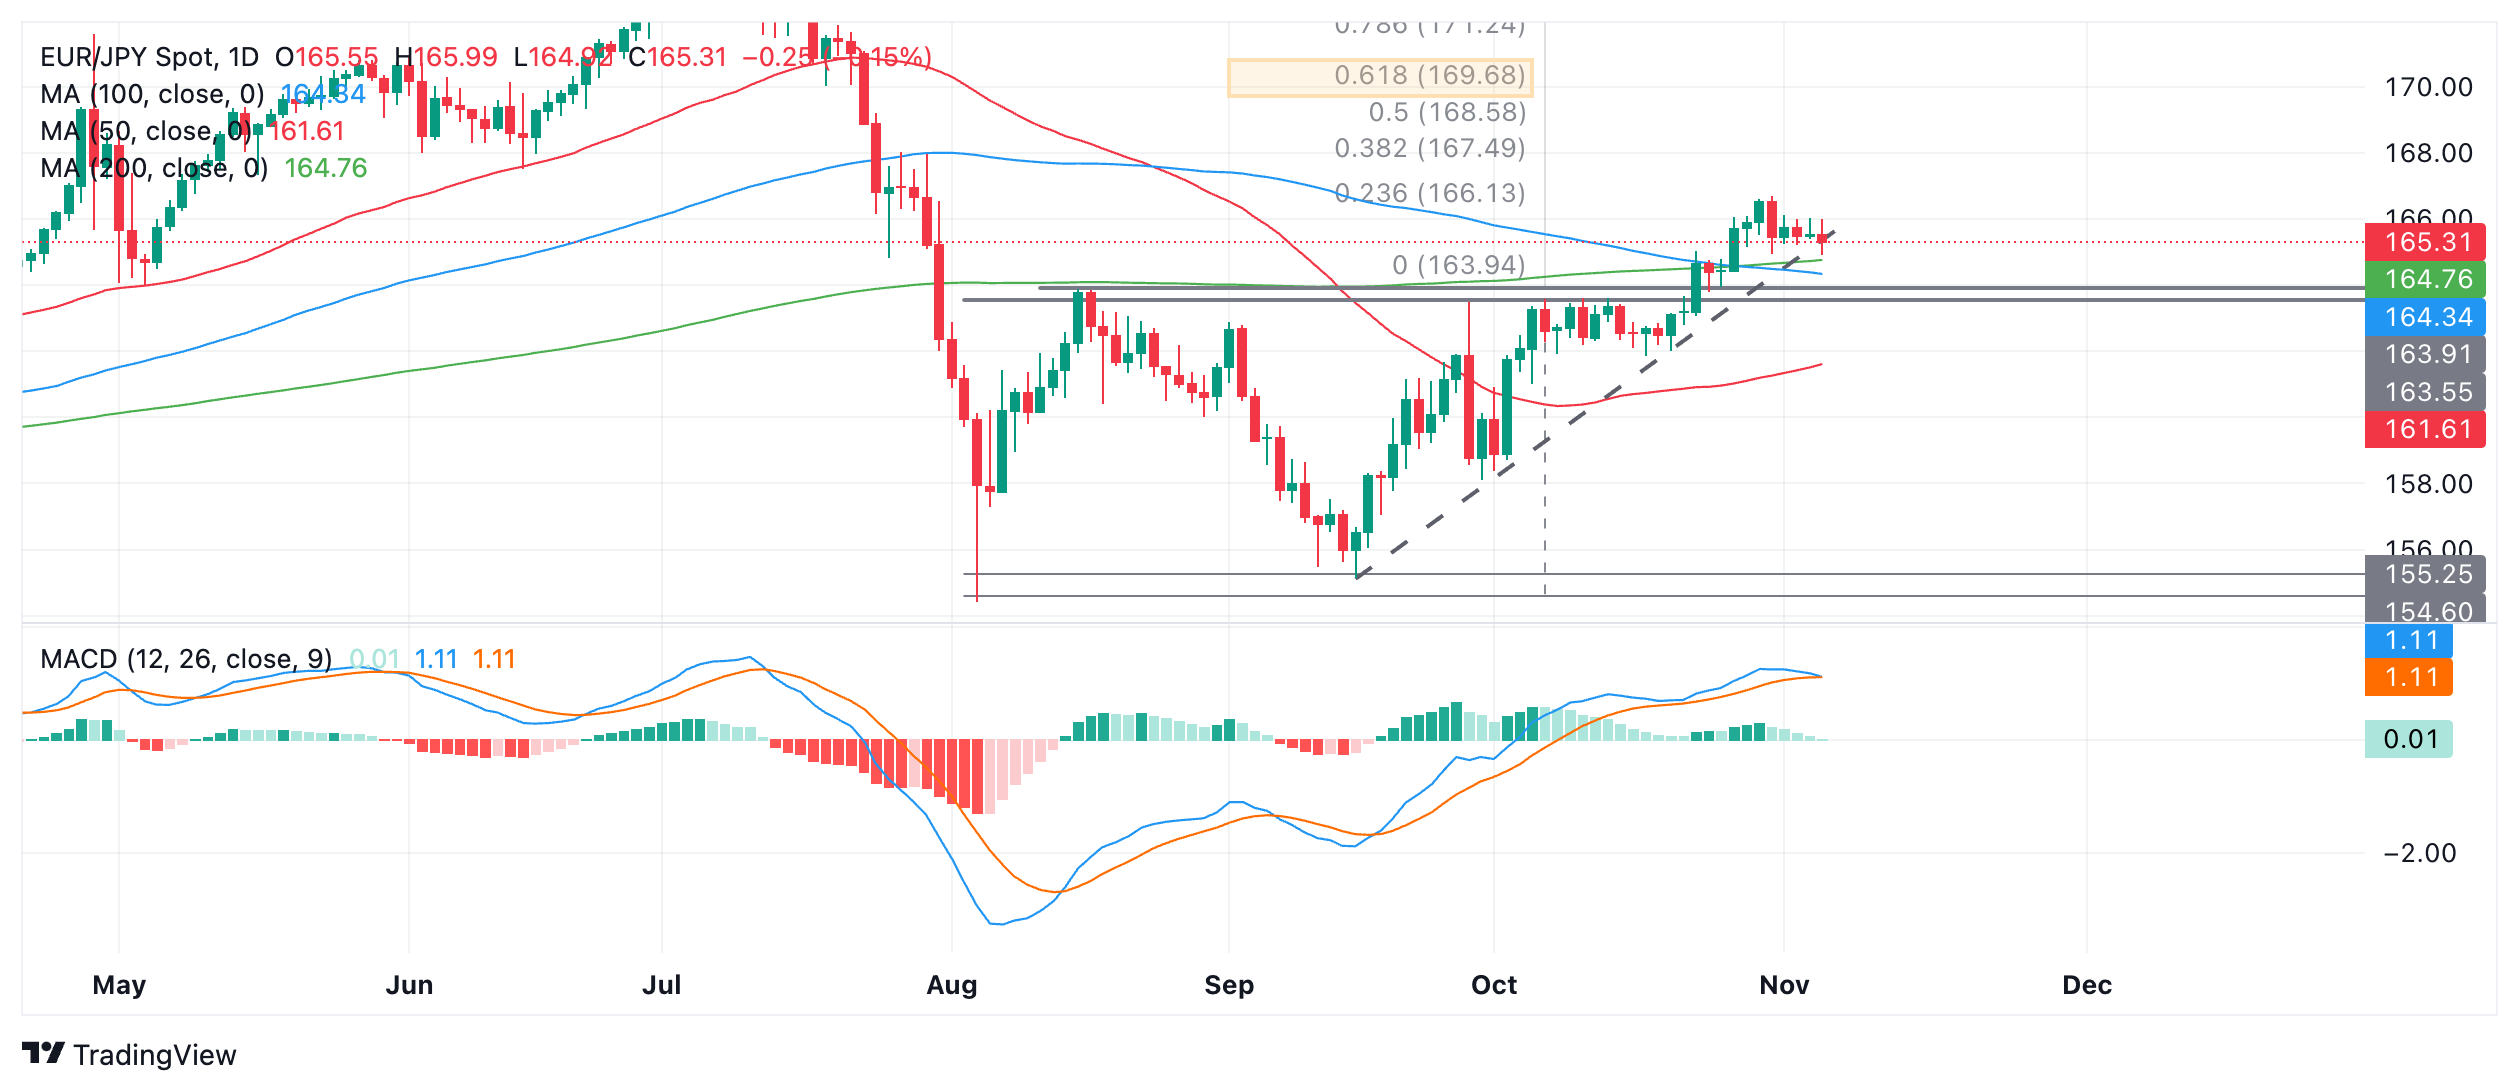
A break above 166.69 (October 31 high) would probably confirm such a continuation higher.
Resistance at 167.96 (July 30 swing high) could provide an initial target and act as a barrier to further upside.
The minimum target for the breakout from the range, however, lies higher, at 169.68, the 61.8% Fibonacci extrapolation of the height of the range to the upside (orange-shaded rectangle).
The Moving Average Convergence Divergence (MACD) is threatening to cross below its signal line, however – a mildly bearish sign which could indicate further near-term weakness for the pair.
There is also an open gap just below price which is only visible on the intraday charts at 164.90. Gaps have a habit of getting filled. If so, further weakness may be on the horizon, with price falling to the bottom of the open gap at 164.45.
Author

Joaquin Monfort
FXStreet
Joaquin Monfort is a financial writer and analyst with over 10 years experience writing about financial markets and alt data. He holds a degree in Anthropology from London University and a Diploma in Technical analysis.


