EUR/JPY Price Forecast: Moves below 168.00 toward nine-day EMA support
- EUR/JPY may retest the upper boundary of the ascending channel around 169.50.
- The 14-day RSI hovers just below 70, reinforcing the bullish bias.
- The nine-day EMA of 168.00 would act as the primary support.

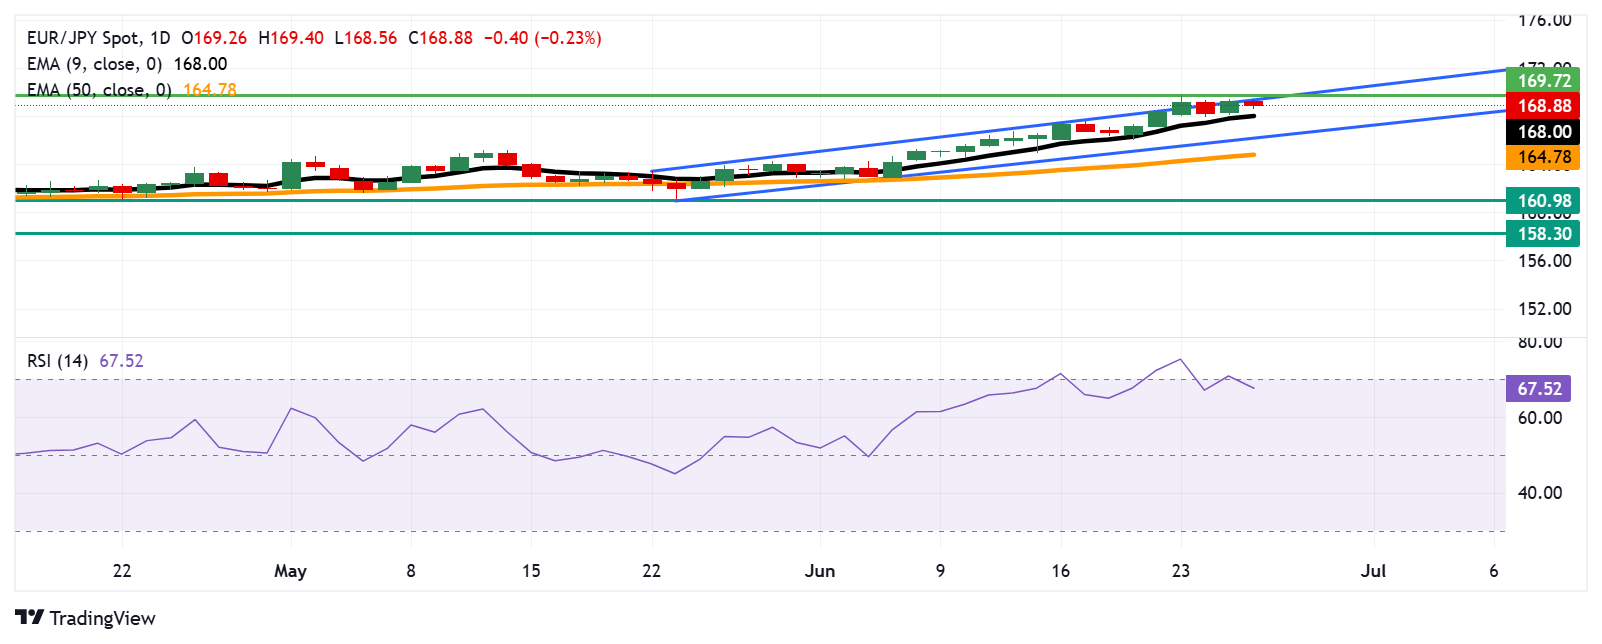
EUR/JPY retraces its recent gains registered in the previous session, trading around 168.90 during the European hours on Thursday. The technical analysis of the daily chart shows that the currency cross remains closer to the upper boundary of the ascending channel pattern, strengthening the bullish bias.
The 14-day Relative Strength Index (RSI) remains slightly below the 70 mark, strengthening the bullish bias. However, traders may adopt caution as the downward correction seems possible once the RSI breaks above the 70 mark, indicating an overbought situation. Additionally, the short-term price momentum is stronger as the EUR/JPY cross is positioned above the nine-day Exponential Moving Average (EMA).
On the upside, the EUR/JPY cross may target the upper boundary of the ascending channel around 169.50, followed by the 11-month high of 169.72, which was recorded on June 23. A successful breach above this crucial resistance zone would strengthen the bullish outlook and pave the way for the currency cross to test the psychological 170.00 level.
The EUR/JPY cross may find the initial support at the nine-day EMA of 168.00. A successful break below this level would dampen the short-term price momentum and put downward pressure on the currency cross to approach the ascending channel’s lower boundary around 166.40, followed by the 50-day EMA at 164.78.
EUR/JPY: Daily Chart
Euro PRICE Today
The table below shows the percentage change of Euro (EUR) against listed major currencies today. Euro was the strongest against the US Dollar.
| USD | EUR | GBP | JPY | CAD | AUD | NZD | CHF | |
|---|---|---|---|---|---|---|---|---|
| USD | -0.62% | -0.71% | -0.86% | -0.30% | -0.61% | -0.54% | -0.66% | |
| EUR | 0.62% | -0.02% | -0.30% | 0.35% | 0.06% | 0.09% | -0.02% | |
| GBP | 0.71% | 0.02% | -0.24% | 0.37% | 0.08% | 0.13% | 0.00% | |
| JPY | 0.86% | 0.30% | 0.24% | 0.60% | 0.30% | 0.32% | 0.23% | |
| CAD | 0.30% | -0.35% | -0.37% | -0.60% | -0.29% | -0.33% | -0.36% | |
| AUD | 0.61% | -0.06% | -0.08% | -0.30% | 0.29% | -0.04% | -0.07% | |
| NZD | 0.54% | -0.09% | -0.13% | -0.32% | 0.33% | 0.04% | -0.03% | |
| CHF | 0.66% | 0.02% | -0.01% | -0.23% | 0.36% | 0.07% | 0.03% |
The heat map shows percentage changes of major currencies against each other. The base currency is picked from the left column, while the quote currency is picked from the top row. For example, if you pick the Euro from the left column and move along the horizontal line to the US Dollar, the percentage change displayed in the box will represent EUR (base)/USD (quote).
Author

Akhtar Faruqui
FXStreet
Akhtar Faruqui is a Forex Analyst based in New Delhi, India. With a keen eye for market trends and a passion for dissecting complex financial dynamics, he is dedicated to delivering accurate and insightful Forex news and analysis.


