EUR/JPY Price Forecast: Falls to near 162.50; next support appears at nine-day EMA
- EUR/JPY may face key resistance at the upper boundary of the ascending channel near 164.50.
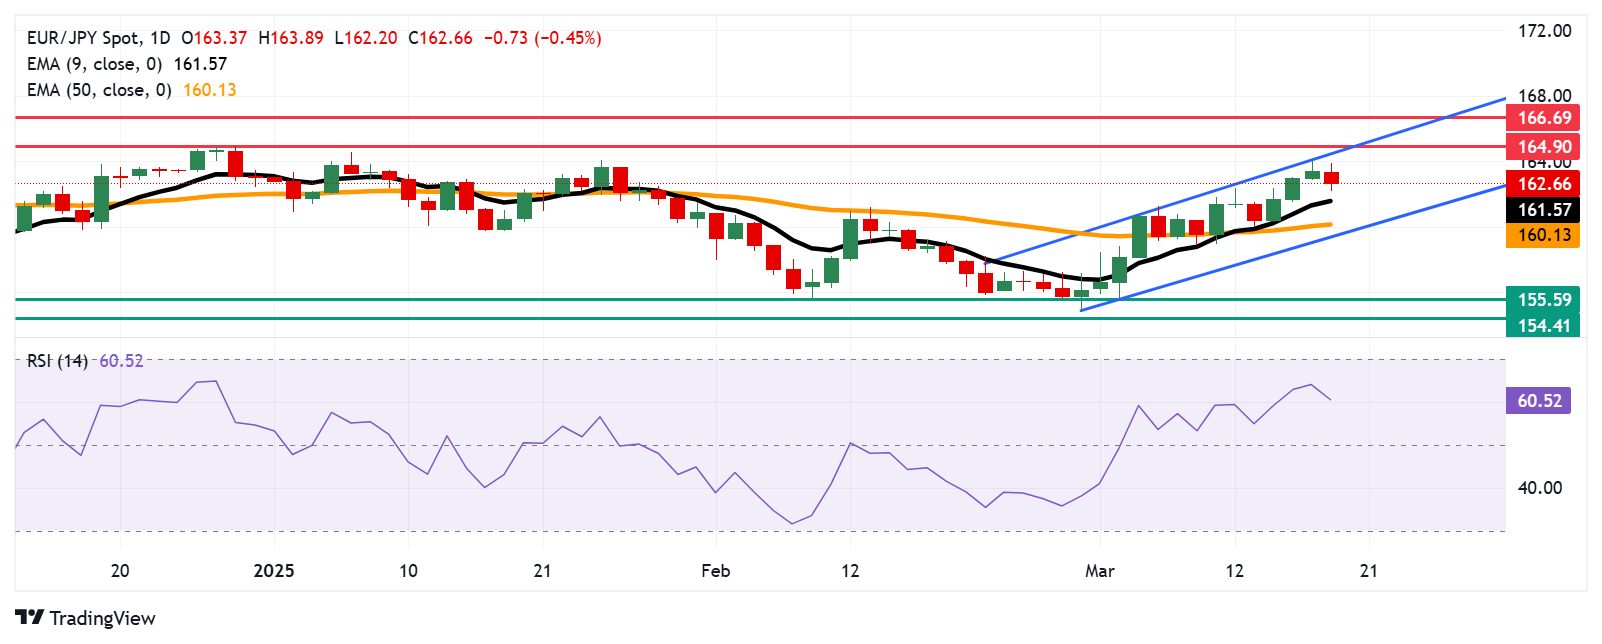
- The 14-day Relative Strength Index stays above 50, strengthening the bullish outlook.
- Initial support is seen at the nine-day EMA around 161.57.

EUR/JPY pauses its three-day winning streak, hovering around 162.60 during early European trading on Wednesday. Technical analysis of the daily chart suggested that the currency cross is trending higher within an ascending channel, indicating a continued bullish bias.
Additionally, the 14-day Relative Strength Index (RSI) remains above 50, reinforcing the bullish outlook for the EUR/JPY cross. Furthermore, the currency cross's position above the nine- and 50-day Exponential Moving Averages (EMAs) underscores strong short- and medium-term price momentum, supporting the potential for further gains.
On the upside, the EUR/JPY cross may encounter its first key resistance at the upper boundary of the ascending channel near 164.50, followed by the four-month high of 164.90, recorded on December 30. A decisive break above this critical zone could strengthen the bullish bias, paving the way for a potential test of the eight-month high at 166.69.
The EUR/JPY cross may find initial support at the nine-day EMA of 161.57. A break below this level could weaken short-term price momentum, leading the currency cross toward the 50-day EMA at 160.13, followed by the lower boundary of the ascending channel at 159.30.
A further decline below this critical support zone could erode medium-term momentum, increasing downward pressure on the currency cross. This could push the EUR/JPY cross toward its monthly low of 155.59, recorded on March 4, and potentially to 154.41, the lowest level last seen in December 2023.
EUR/JPY: Daily Chart
Euro PRICE Today
The table below shows the percentage change of Euro (EUR) against listed major currencies today. Euro was the weakest against the US Dollar.
| USD | EUR | GBP | JPY | CAD | AUD | NZD | CHF | |
|---|---|---|---|---|---|---|---|---|
| USD | 0.50% | 0.25% | -0.01% | 0.19% | 0.48% | 0.54% | 0.06% | |
| EUR | -0.50% | -0.25% | -0.49% | -0.31% | 0.00% | 0.04% | -0.43% | |
| GBP | -0.25% | 0.25% | -0.25% | -0.06% | 0.25% | 0.29% | -0.20% | |
| JPY | 0.01% | 0.49% | 0.25% | 0.17% | 0.50% | 0.51% | 0.06% | |
| CAD | -0.19% | 0.31% | 0.06% | -0.17% | 0.32% | 0.37% | -0.14% | |
| AUD | -0.48% | -0.00% | -0.25% | -0.50% | -0.32% | 0.04% | -0.40% | |
| NZD | -0.54% | -0.04% | -0.29% | -0.51% | -0.37% | -0.04% | -0.48% | |
| CHF | -0.06% | 0.43% | 0.20% | -0.06% | 0.14% | 0.40% | 0.48% |
The heat map shows percentage changes of major currencies against each other. The base currency is picked from the left column, while the quote currency is picked from the top row. For example, if you pick the Euro from the left column and move along the horizontal line to the US Dollar, the percentage change displayed in the box will represent EUR (base)/USD (quote).
BRANDED CONTENT
The right broker can enhance your trading experience by offering key features suited to your strategy. Discover a curated list of brokers designed to meet various trading preferences.
Author

Akhtar Faruqui
FXStreet
Akhtar Faruqui is a Forex Analyst based in New Delhi, India. With a keen eye for market trends and a passion for dissecting complex financial dynamics, he is dedicated to delivering accurate and insightful Forex news and analysis.


