|

EUR/JPY Price Analysis: The key resistance level is located near 170.00

  • EUR/JPY trades on a stronger note near 169.75 in Thursday’s early European session, gaining 0.22% on the day. 
  • The cross maintains a positive stance above the key 100-period EMA, with a bullish RSI indicator. 
  • The first upside barrier is seen at the 170.00 psychological mark; the initial support level is seen at 169.32. 

The EUR/JPY cross gathers strength around 169.75 during the early European session on Thursday. The uncertainty that the Bank of Japan (BoJ) will announce a reduction in monthly government bond purchases amid a weaker economy continues to undermine the Japanese Yen (JPY) and create a tailwind for EUR/JPY. Market players await the Bank of Japan (BoJ) monetary policy meeting on Friday, which is widely expected to leave interest rates unchanged. 

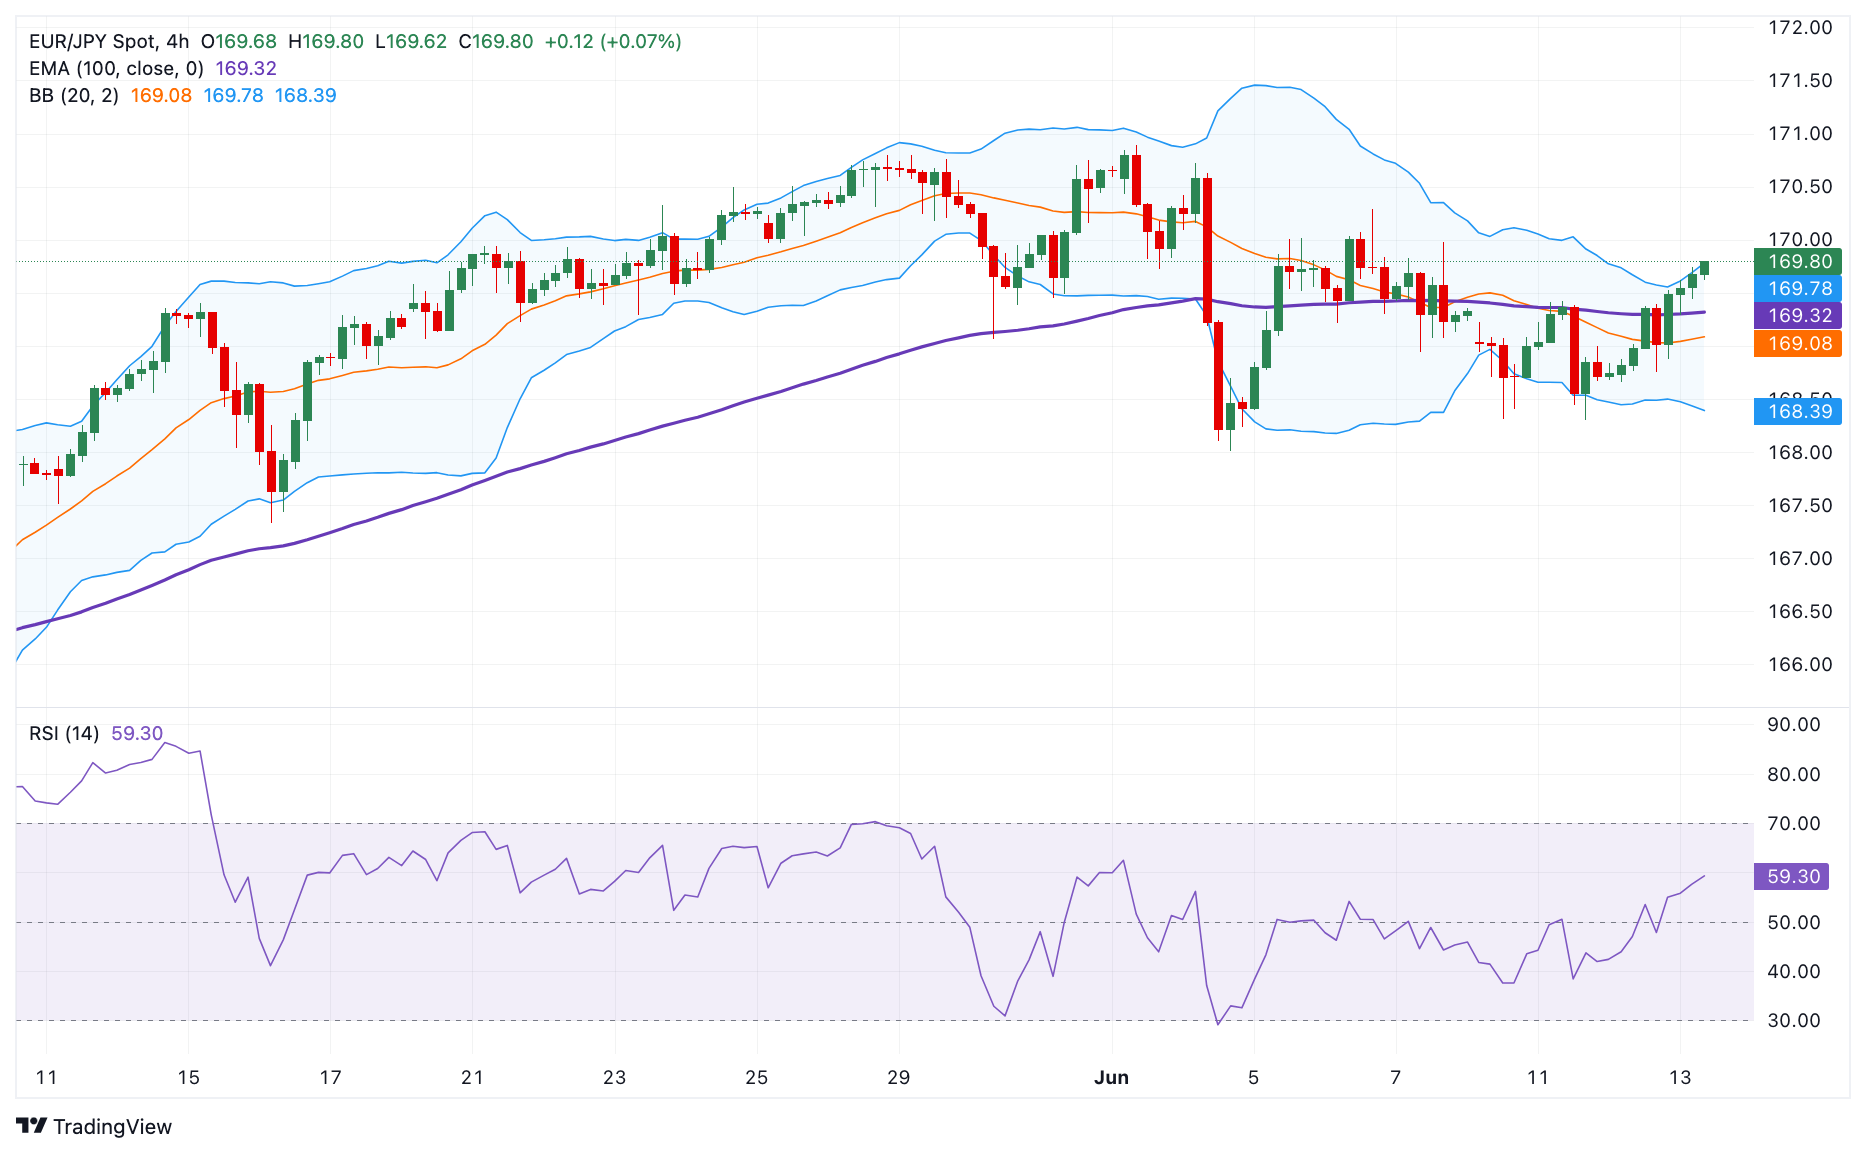
According to the 4-hour chart, EUR/JPY keeps the bullish vibe unchanged as the cross is above the key 100-period Exponential Moving Averages (EMA). The upward momentum is supported by the Relative Strength Index (RSI), which stands in bullish territory near 58.0, supporting the buyers for the time being. 

A decisive break above 169.75, the upper boundary of Bollinger Band, will attract some buyers to the 170.00 psychological level. Further north, the additional upside filter to watch is 170.85, a high of June 3, en route to an all-time high of 171.60.   

On the downside, the initial support level is located at 169.32, the 100-period EMA. A breach of the mentioned level could pave the way to 168.75, a low of June 12. Extended losses will see a drop to 168.40, the lower limit of Bollinger Band. 

EUR/JPY 4-hour chart

EUR/JPY

Overview
Today last price169.74
Today Daily Change0.34
Today Daily Change %0.20
Today daily open169.4
 
Trends
Daily SMA20169.65
Daily SMA50167.42
Daily SMA100164.72
Daily SMA200161.78
 
Levels
Previous Daily High169.59
Previous Daily Low168.66
Previous Weekly High170.89
Previous Weekly Low168.01
Previous Monthly High170.8
Previous Monthly Low164.02
Daily Fibonacci 38.2%169.23
Daily Fibonacci 61.8%169.02
Daily Pivot Point S1168.85
Daily Pivot Point S2168.29
Daily Pivot Point S3167.92
Daily Pivot Point R1169.77
Daily Pivot Point R2170.14
Daily Pivot Point R3170.7

Author

Lallalit Srijandorn

Lallalit Srijandorn is a Parisian at heart. She has lived in France since 2019 and now becomes a digital entrepreneur based in Paris and Bangkok.

More from Lallalit Srijandorn
Share:

Markets move fast. We move first.

Orange Juice Newsletter brings you expert driven insights - not headlines. Every day on your inbox.

By subscribing you agree to our Terms and conditions.

Editor's Picks

EUR/USD moves sideways below 1.1800 on Christmas Eve

EUR/USD struggles to find direction and trades in a narrow channel below 1.1800 after posting gains for two consecutive days. Bond and stock markets in the US will open at the usual time and close early on Christmas Eve, allowing the trading action to remain subdued. 

GBP/USD keeps range around 1.3500 amid quiet markets

GBP/USD keeps its range trade intact at around 1.3500 on Wednesday. The Pound Sterling holds the upper hand over the US Dollar amid pre-Christmas light trading as traders move to the sidelines heading into the holiday season. 

Gold retreats from record highs, trades below $4,500

Gold retreats after setting a new record-high above $4,520 earlier in the day and trades in a tight range below $4,500 as trading volumes thin out ahead of the Christmas break. The US Dollar selling bias remains unabated on the back of dovish Fed expectations, which continues to act as a tailwind for the bullion amid persistent geopolitical risks.

Bitcoin slips below $87,000 as ETF outflows intensify, whale participation declines

Bitcoin price continues to trade around $86,770 on Wednesday, after failing to break above the $90,000 resistance. US-listed spot ETFs record an outflow of $188.64 million on Tuesday, marking the fourth consecutive day of withdrawals.

Economic outlook 2026-2027 in advanced countries: Solidity test

After a year marked by global economic resilience and ending on a note of optimism, 2026 looks promising and could be a year of solid economic performance. In our baseline scenario, we expect most of the supportive factors at work in 2025 to continue to play a role in 2026.

Avalanche struggles near $12 as Grayscale files updated form for ETF

Avalanche trades close to $12 by press time on Wednesday, extending the nearly 2% drop from the previous day. Grayscale filed an updated form to convert its Avalanche-focused Trust into an ETF with the US Securities and Exchange Commission.