|

EUR/JPY Price Analysis: Still scope for a move lower

  • EUR/JPY keeps the trade close to recent tops above 134.00.
  • The bearish divergence in the RSI could prompt a leg lower.

EUR/JPY once again meets resistance just above 134.00 the figure, area coincident with recent YTD peaks.

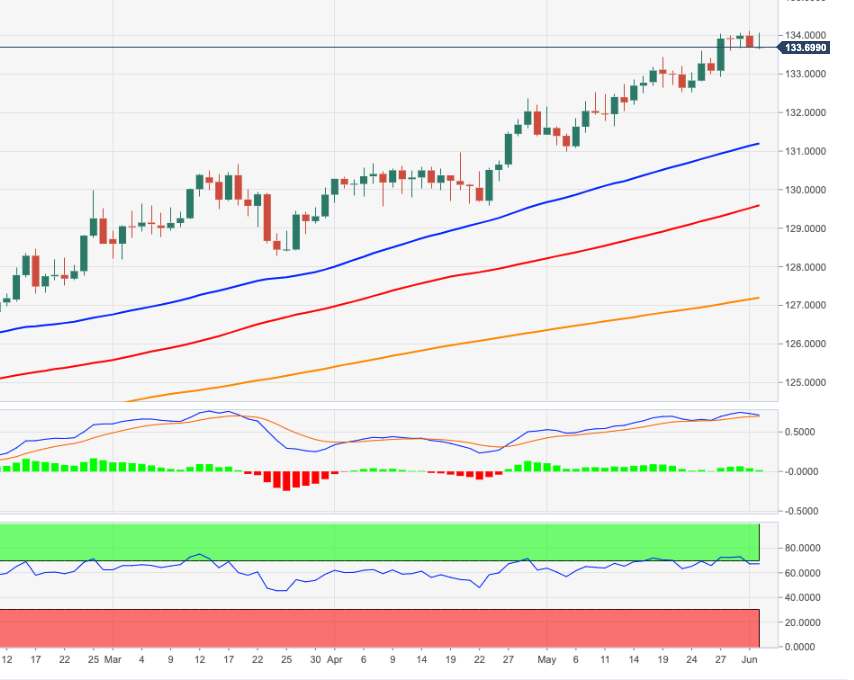
If the buying impulse accelerates, then EUR/JPY could attempt a visit to the September/October 2017 highs in the 134.40/50 band. Further gains appear likely as long as the cross remains underpinned by the immediate support line (off the March lows) near 131.30. This area is also reinforced by the proximity of the 50-day SMA (131.35).

However, a corrective downside stays well on the cards as the cross flirts with the overbought territory. This view is reinforced by the bearish divergence in the daily RSI (68.70).

In the broader picture, while above the 200-day SMA at 127.15 the broader outlook for the cross should remain constructive.

EUR/JPY daily chart

EUR/JPY

Overview
Today last price133.73
Today Daily Change42
Today Daily Change %0.03
Today daily open133.69
 
Trends
Daily SMA20132.77
Daily SMA50131.29
Daily SMA100129.52
Daily SMA200127.16
 
Levels
Previous Daily High134.13
Previous Daily Low133.69
Previous Weekly High134.06
Previous Weekly Low132.52
Previous Monthly High134.06
Previous Monthly Low130.98
Daily Fibonacci 38.2%133.86
Daily Fibonacci 61.8%133.96
Daily Pivot Point S1133.55
Daily Pivot Point S2133.4
Daily Pivot Point S3133.11
Daily Pivot Point R1133.98
Daily Pivot Point R2134.27
Daily Pivot Point R3134.42

Author

Pablo Piovano

Born and bred in Argentina, Pablo has been carrying on with his passion for FX markets and trading since his first college years.

More from Pablo Piovano
Share:

Editor's Picks

EUR/USD tests nine-day EMA support near 1.1850

EUR/USD inches lower during the Asian hours on Monday, trading around 1.1870 at the time of writing. The 14-day Relative Strength Index momentum indicator at 56 stays above the midline, confirming improving momentum. RSI has cooled from prior overbought readings but stabilizes above 50, suggesting dips could stay limited before buyers reassert control.

GBP/USD flat lines as traders await key UK macro data and FOMC minutes

The GBP/USD pair kicks off a new week on a subdued note and oscillates in a narrow range, just below mid-1.3600s, during the Asian session. Moreover, the mixed fundamental backdrop warrants some caution for aggressive traders as the market focus now shifts to this week's important releases from the UK and the US.

Gold slides below $5,000 amid USD uptick and positive risk tone; downside seems limited

Gold attracts fresh sellers at the start of a new week and reverses a part of Friday's strong move up of over $150 from sub-$4,900 levels. The commodity slides back below the $5,000 psychological mark during the Asian session, though the downside potential seems limited amid a combination of supporting factors.

Bitcoin, Ethereum and Ripple consolidate within key ranges as selling pressure eases

Bitcoin and Ethereum prices have been trading sideways within key ranges following the massive correction. Meanwhile, XRP recovers slightly, breaking above the key resistance zone. The top three cryptocurrencies hint at a potential short-term recovery, with momentum indicators showing fading bearish signs.

Global inflation watch: Signs of cooling services inflation

Realized inflation landed close to expectations in January, as negative base effects weighed on the annual rates. Remaining sticky inflation is largely explained by services, while tariff-driven goods inflation remains limited even in the US.

Ripple Price Forecast: XRP potential bottom could be in sight

Ripple edges up above the intraday low of $1.35 at the time of writing on Friday amid mixed price actions across the crypto market. The remittance token failed to hold support at $1.40 the previous day, reflecting risk-off sentiment amid a decline in retail and institutional sentiment.