|

EUR/JPY Price Analysis: Pair slides to 162.15 as bearish momentum intensifies

  • EUR/JPY drops sharply on Monday toward key 162.00 support levels.
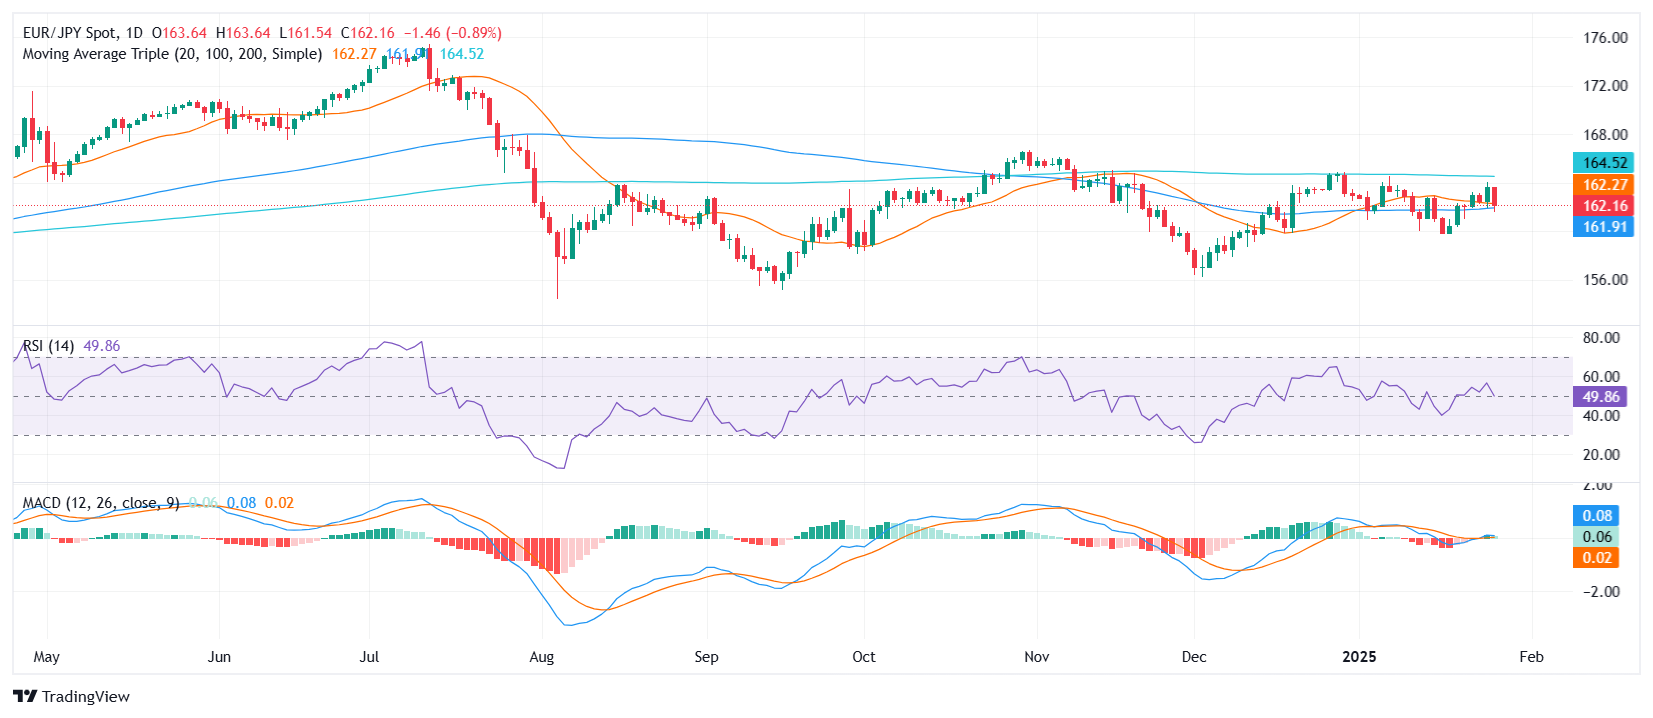
  • Technical indicators show mounting selling pressure, with the pair nearing the 20- and 100-day SMA convergence.
  • Focus shifts to whether the pair can stabilize around 162.00 or risk further downside.

The EUR/JPY cross extended its losses on Monday, falling by 0.90% to settle at 162.15. The move highlights increased bearish momentum as the pair approaches a critical technical juncture, with the 20- and 100-day Simple Moving Average (SMA) convergence at 162.00 set to serve as a significant support zone. The steep decline marks a continuation of the downward trend observed over recent sessions, putting buyers under renewed pressure.

Technical indicators reinforce the bearish outlook. The Relative Strength Index (RSI) has dropped sharply to 49, slipping into negative territory and signaling weakening buying interest. Simultaneously, the Moving Average Convergence Divergence (MACD) histogram displays decreasing green bars, reflecting fading bullish traction and a growing bearish bias in the short term.

Looking ahead, the 162.00 level, where the 20- and 100-day SMAs converge, will be crucial in determining the pair’s next move. A decisive break below this area could open the door to further losses, with the next support seen at 161.50. Conversely, stabilization above this zone may encourage buyers to regroup and attempt a recovery toward the 163.00 resistance level. The pair’s ability to hold its ground at these critical levels will shape its trajectory in the coming sessions.

EUR/JPY daily chart

Author

Patricio Martín

Patricio is an economist from Argentina passionate about global finance and understanding the daily movements of the markets.

More from Patricio Martín
Share:

Editor's Picks

EUR/USD remains offered below 1.1600, seems vulnerable near multi-month low

The EUR/USD pair struggles to capitalize on the overnight bounce from the 1.1530 region, or the lowest level since November 2025, and lower for the third consecutive day on Wednesday. Spot prices slide back below the 1.1600 mark during the Asian session and seem vulnerable to slide further.

GBP/USD slips below key averages as geopolitical risks mount

GBP/USD fell about 0.35% on Tuesday, settling around 1.3350 after slipping below the 200-day Exponential Moving Average for the first time since early December. The pair has pulled back sharply from its late-January high near 1.3870, shedding over 500 pips in a series of lower highs and lower lows. 

Gold rebounds ahead of US ADP, will it last?

Gold finds renewed Asian bids and retests $5,230 early Wednesday after the heavy sell-off on Tuesday. The US Dollar stands tall amid escalating Middle East tensions and reduced dovish Fed expectations. Gold defends $5,000 or 50% Fibo level after facing rejection at the 78.6% Fibo resistance at $5,342 amid bullish RSI.  

Bitcoin, Ethereum and Ripple struggle for direction as consolidation persists

Bitcoin, Ethereum and Ripple prices trade with a cautious tone at the time of writing on Wednesday as upside momentum continues to fade across the broader crypto market. BTC remains within a parallel channel, ETH struggles below key resistance, while XRP remains fragile within a descending channel. These top three cryptocurrencies by market capitalization continue to struggle to establish a directional bias amid the consolidation phase.

Energy shock 2.0: Why rising Gas prices could hit the Euro

Even without a confirmed, sustained disruption, the mere risk to a key global energy chokepoint is enough to inject a significant premium into European Gas markets. And for the Euro, that matters.

Ripple falters amid sell-off jitters and negative funding rates

Ripple (XRP) has come under pressure, drifting lower to $1.35 at the time of writing on Tuesday. The over 2% correction looks poised to erase the previous day’s gains, which lifted the remittance token to $1.42.