|

EUR/JPY Price Analysis: Interim contention emerges at 158.80

  • EUR/JPY adds to Thursday’s corrective decline.
  • Further losses appear on the cards near term.

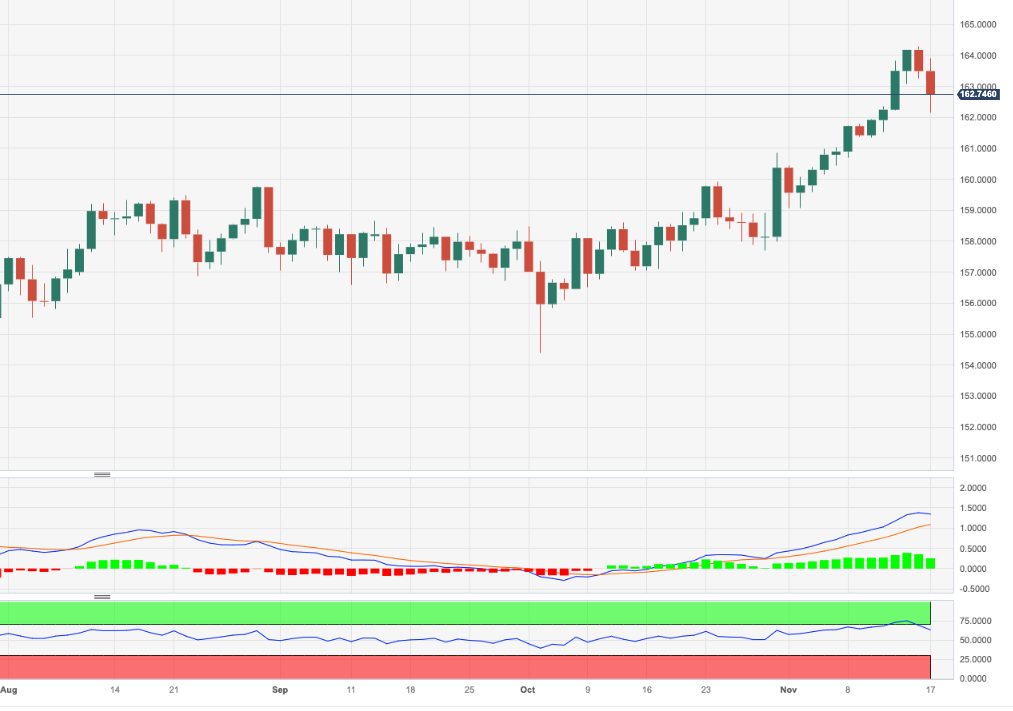
EUR/JPY comes under extra selling pressure following Thursday’s 2023 peaks north of the 164.00 hurdle.

The continuation of the retracement from overbought levels appears on the cards for the time being. Against that, the cross could initially revisit the provisional 55-day SMA near 158.80 prior to the weekly low of 157.69 (October 30).

So far, the longer term positive outlook for the cross appears favoured while above the 200-day SMA, today at 152.68.

EUR/JPY daily chart
EUR/JPY

Overview
Today last price162.79
Today Daily Change145
Today Daily Change %-0.43
Today daily open163.49
 
Trends
Daily SMA20160.55
Daily SMA50158.8
Daily SMA100157.97
Daily SMA200152.61
 
Levels
Previous Daily High164.31
Previous Daily Low163.26
Previous Weekly High161.95
Previous Weekly Low160.15
Previous Monthly High160.85
Previous Monthly Low154.39
Daily Fibonacci 38.2%163.66
Daily Fibonacci 61.8%163.91
Daily Pivot Point S1163.06
Daily Pivot Point S2162.63
Daily Pivot Point S3162.01
Daily Pivot Point R1164.11
Daily Pivot Point R2164.74
Daily Pivot Point R3165.17

Author

Pablo Piovano

Born and bred in Argentina, Pablo has been carrying on with his passion for FX markets and trading since his first college years.

More from Pablo Piovano

Share:

Editor's Picks

GBP/USD bounces off four-day lows, still below 1.3500

GBP/USD sticks to the bearish tone on Thursday, coming down to the 1.3480 region in the latter part of the NA session. In the meantime, Cable’s weakness comes as investors continue to assess mixed UK data, poor US results, and the persistent uncertainty surrounding the US-Iran conflict.

EUR/USD looks apathetic around 1.1530

EUR/USD reverses Wednesday’s downtick and trades with modest gains in the 1.1530 region following the end of the NA session on Thursday. The pair’s tepid advance comes on the back of the absence of clear direction in the US Dollar despite tensions from the Middle East appear far from alleviated. Later on Friday, investors are expected to monitor the the releases of another revision of GDP figures in the Euroland, US Retail Sales and the preliminary U-Mich gauge.

Gold loses the grip, recedes toward $4,350

Gold extends its intraday pullback on Thursday, retesting the $4,350 zone per troy ounce, or three-day troughs. Meanwhile, the yellow metal continues to monitor developments from the Middle East as well as bets surrounding the potential Fed’s rate path.

Ethereum Price Forecast: Fidelity plans to add staking to ETH ETF amid yield debate
Asset manager Fidelity has filed with the US Securities and Exchange Commission (SEC) to permit staking in its Ethereum (ETH) exchange-traded fund (ETF), the Fidelity Ethereum Fund (FETH), which holds over $898 million in net assets.
Week ahead – Summer lull could be tested by geopolitics and central bank expectations

US dollar stabilizes as September Fed hike bets remain subdued. Market volatility stays low, but thin liquidity could amplify movements. Key UK data could challenge pound strength; euro craves bullish catalysts.

Why is Crude Oil priced for a reopening the ships haven't made?
Fourteen vessels crossed the Strait of Hormuz on Tuesday. Before the war, the count ran near 120 a day. In the sessions since the waterway was publicly declared open, Brent has drifted back to $87 and West Texas Intermediate (WTI) to $81, both a little lower again on Wednesday, with daily momentum on each unwound from the top of its range in late July to the low twenties now.















