|

EUR/JPY Price Analysis: Falls to two-day lows below 159.00, as bears loom

  • EUR/JPY's loss may indicate a bearish shift, with a possible close below Ichimoku Cloud signaling further downtrend.
  • Immediate support levels include 159.50 and Tenkan-Sen at 157.62, with significant downside risk at Kijun Sen at 156.64.
  • For a bullish reversal, EUR/JPY needs to stay above Senkou Span B at 158.71, targeting 159.00 and 160.18.

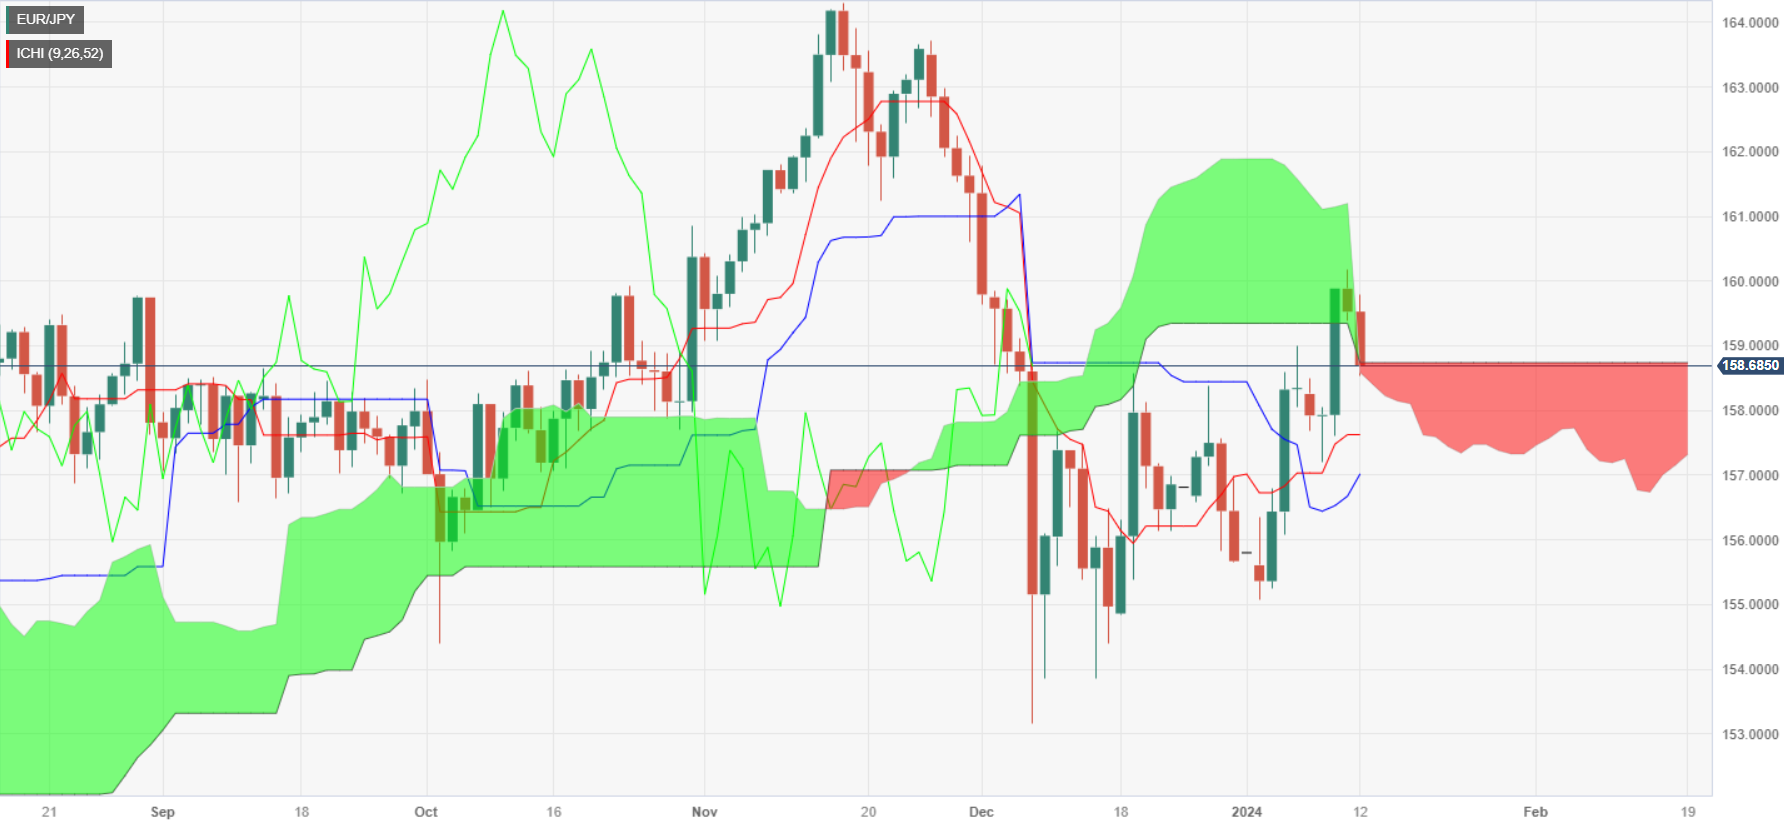
The Euro (EUR) is at the brink of turning decisively bearish against the Japanese Yen (JPY), printing losses of 0.44% on Friday, though set to finish the week with 0.26% gains. Nevertheless, as price action cracks inside the Ichimoku Cloud (Kumo), sellers pressure the pain, which, if it prints a daily close below the Kumo, would pave the way for further losses. The EUR/JPY trades at 158.61, after hitting a high of 159.57.

As mentioned above, EUR/JPY bears are gathering momentum, which could extend if they reclaim the December 19 swing high of 159.57, which could pave the way for breaking the next support seen at the 159.50 area, the bottom of the Kumo. In that outcome, the cross-pair could plunge sharply and challenge the Tenkan-Sen at 157.62, followed by the Senkou Span A at 157.14. Further downside is seen at the Kijun Sen at 156.64.

On the flip side, if buyers' momentum increases, and they keep the EUR/JPY above the Senkou Span B at 158.71, that could sponsor a move toward the 159.00 mark Once broken, the next intermediate resistance level would be the January 11 high at 160.18.

EUR/JPY Price Action – Daily Chart
EUR/JPY Technical Levels

EUR/JPY

Overview
Today last price158.68
Today Daily Change-0.85
Today Daily Change %-0.53
Today daily open159.53
 
Trends
Daily SMA20157.14
Daily SMA50159.24
Daily SMA100158.65
Daily SMA200155.68
 
Levels
Previous Daily High160.18
Previous Daily Low159.38
Previous Weekly High159
Previous Weekly Low155.07
Previous Monthly High161.78
Previous Monthly Low153.17
Daily Fibonacci 38.2%159.69
Daily Fibonacci 61.8%159.88
Daily Pivot Point S1159.21
Daily Pivot Point S2158.9
Daily Pivot Point S3158.41
Daily Pivot Point R1160.01
Daily Pivot Point R2160.5
Daily Pivot Point R3160.81

Author

Christian Borjon Valencia

Markets analyst, news editor, and trading instructor with over 14 years of experience across FX, commodities, US equity indices, and global macro markets.


More from Christian Borjon Valencia
Share:

Editor's Picks

AUD/USD: Next on the upside is 0.7000

AUD/USD leaves behind Monday’s downtick and trades with marked gains, approaching the critical 0.7000 yardstick ahead of the opening bell in Asia on Wednesday. The pair’s solid performance follows the Greenback’s fresh downward trend amid cooling geopolitical tensions and caution ahead of the US CPI data.

USD/JPY extends retreat below 158.50 as intervention risks loom

USD/JPY is dropping below 158.50 in the Asian session on Tuesday, snapping a two-day winning streak and pulling back from an over two-week top touched the previous day, despite Japan's soft PPI inflation print. Bulls turn cautious amid speculation that authorities will step in to prop up the Japanese Yen, which, in turn, weighs on the pair.

Gold: Bears struggle to breach below $4,150

Gold now gives away its initial gains and resumes its decline, revisiting the $4,160 region per troy ounce on Tuesday. The precious metal’s pullback comes despite the fresh downward trend in the Greenback in combination with a mixed performance of US Treasury yields across the board and easing tensions on the geopolitical front.

HYPE falls to $80 as ETF outflows and flat volume weigh on Hyperliquid
Hyperliquid (HYPE) declines 4% on Tuesday, briefly touching $80 as perpetual volumes stay flat and institutional interest decreases. Perpetual volume on the platform saw a modest increase last week from $41.5 billion to $42.5 billion. The metric matters because 99% of fees Hyperliquid captures from trading volume flow toward token buybacks.
S&P 500 earnings just hit a record. The AI data centre bill hasn't landed yet
S&P 500 companies are on track for a third straight quarter of earnings growth above 25%, according to FactSet. Their profit margin hit 17% in the April-June quarter, the highest in FactSet data going back to 2009. The cash behind those earnings has been shrinking for two years, and almost all of the shrinkage is in the handful of companies building data centres for artificial intelligence (AI).
Has Bitcoin really escaped the macro forces it was built to fight?
Over 17 years ago, Satoshi Nakamoto designed Bitcoin (BTC) on the back of a global financial crisis as an alternative to the global monetary system outside the control of central banks, governments and traditional intermediaries. This raises a key question: has Bitcoin really become independent of the macroeconomic forces it was built to challenge?