|

EUR/JPY Price Analysis: Eyes top of Ichimoku cloud on risk-appetite, buyers target 158.00

  • EUR/JPY trades with a 0.47% gain, bouncing from daily lows of 156.98.
  • Technical indicators suggest potential upward movement, targeting the October 12 high.
  • A successful breach of the Kumo top could pave the way to the YTD high of 159.76.

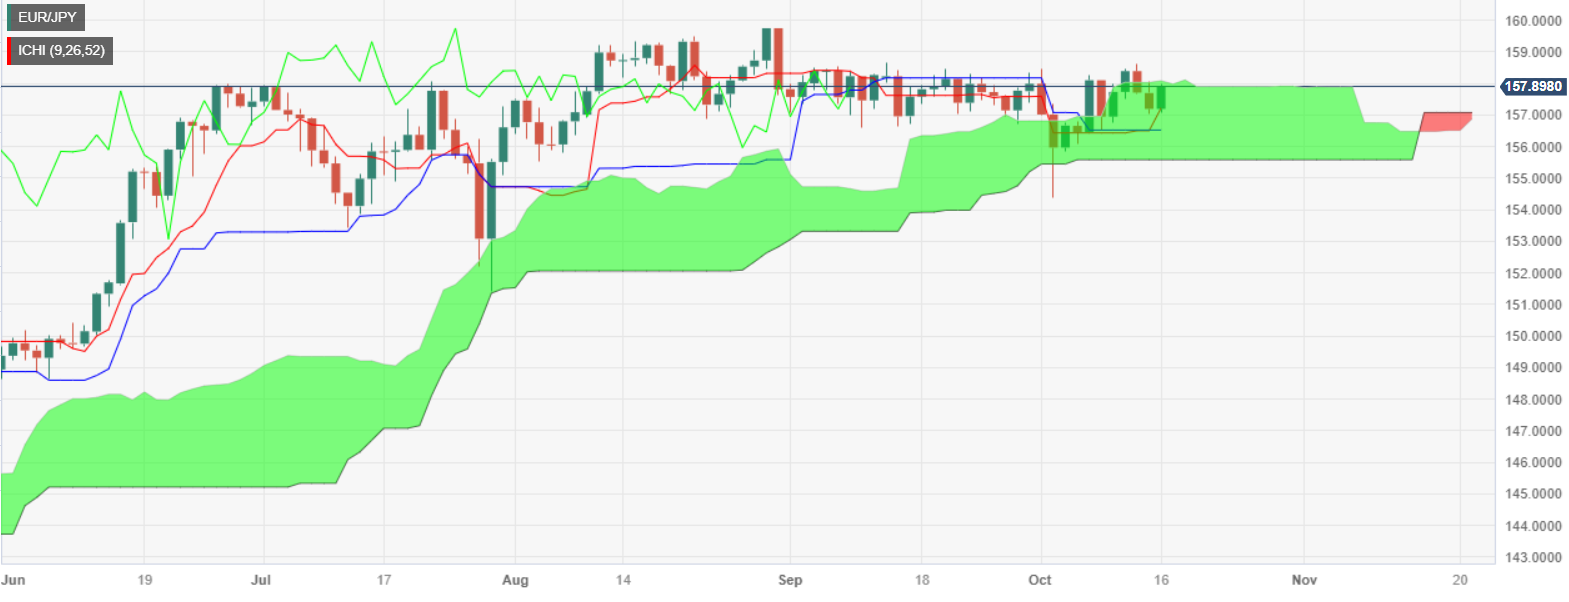
The EUR/JPY pair tests the top of the Ichimoku Cloud (Kumo), at around 157.80, amid risk sentiment improvement, as a bullish-engulfing chart pattern looms. At the time of writing, the cross-pair prints gains of 0.47%, after bouncing off daily lows of 156.98.

From a technical standpoint, the EUR/JPY remains in consolidation, threatening to crack the top of the Kumo, which would expose the October 12 high of 158.61. A breach of that area would open the door to challenge the year-to-date (YTD) high of 159.76.

Conversely, if EUR/JPY sellers moved in, the first support would be the Tenkan-Sen line at 157.21. Once cleared, the next support would be the Senkou-Span B at 157.05, before challenging the 157.00 figure. If the cross-pair drops below those levels, the bottom of the Kumo would be up for grabs at 155.60/65, ahead of the October 3 swing low of 154.34.

EUR/JPY Price Action – Daily chart

EUR/JPY Technical Levels

EUR/JPY

Overview
Today last price157.8
Today Daily Change0.61
Today Daily Change %0.39
Today daily open157.19
 
Trends
Daily SMA20157.48
Daily SMA50157.89
Daily SMA100156.2
Daily SMA200150.3
 
Levels
Previous Daily High158.05
Previous Daily Low157.05
Previous Weekly High158.61
Previous Weekly Low156.51
Previous Monthly High158.66
Previous Monthly Low156.58
Daily Fibonacci 38.2%157.43
Daily Fibonacci 61.8%157.67
Daily Pivot Point S1156.81
Daily Pivot Point S2156.43
Daily Pivot Point S3155.81
Daily Pivot Point R1157.81
Daily Pivot Point R2158.43
Daily Pivot Point R3158.81

Author

Christian Borjon Valencia

Markets analyst, news editor, and trading instructor with over 14 years of experience across FX, commodities, US equity indices, and global macro markets.

More from Christian Borjon Valencia
Share:

Editor's Picks

EUR/USD looks offered below 1.1900

EUR/USD keeps its bearish tone unchanged ahead of the opening bell in Asia, returning to the sub-1.1900 region following a firmer tone in the US Dollar. Indeed, the pair reverses two consecutive daily gains amid steady caution ahead of Wednesday’s key US Nonfarm Payrolls release.
 

GBP/USD slips back to daily lows near 1.3640

GBP/USD drops to daily lows near 1.3640 as sellers push harder and the Greenback extends its rebound in the latter part of Tuesday’s session. Looking ahead, the combination of key US releases, including NFP and CPI, alongside important UK data, should keep the pound firmly in focus over the coming days.

Gold declines to near $5,050, focus shifts to US jobs data

Gold price falls to near $5,045 during the early Asian session on Wednesday. Traders assess whether prices have found a floor following a historic sell-off. The delayed US employment report for January, which was pushed back due to the recently ended four-day government shutdown, will take center stage later on Wednesday.

Ethereum: Whales buy the dip amid rising short bets

Following one of Ethereum's largest weekly drawdowns, whales are slowly returning to action alongside a drop in retail selling pressure. After slightly selling into the decline at the start of the month, whales or wallets with a balance of 10K-100K ETH began buying the dip last Wednesday as prices crashed further. 

Dollar drops and stocks rally: The week of reckoning for US economic data

Following a sizeable move lower in US technology Stocks last week, we have witnessed a meaningful recovery unfold. The USD Index is in a concerning position; the monthly price continues to hold the south channel support.

XRP holds $1.40 amid ETF inflows and stable derivatives market

Ripple trades under pressure, with immediate support at $1.40 holding at the time of writing on Tuesday. A recovery attempt from last week’s sell-off to $1.12 stalled at $1.54 on Friday, leading to limited price action between the current support and the resistance.