EUR/JPY Price Analysis: Bulls remain dominant despite bearish signals on the daily and hourly chart


  • The EUR/JPY is trading around 162.76, recording a 0.31% loss in Tuesday's trading session.
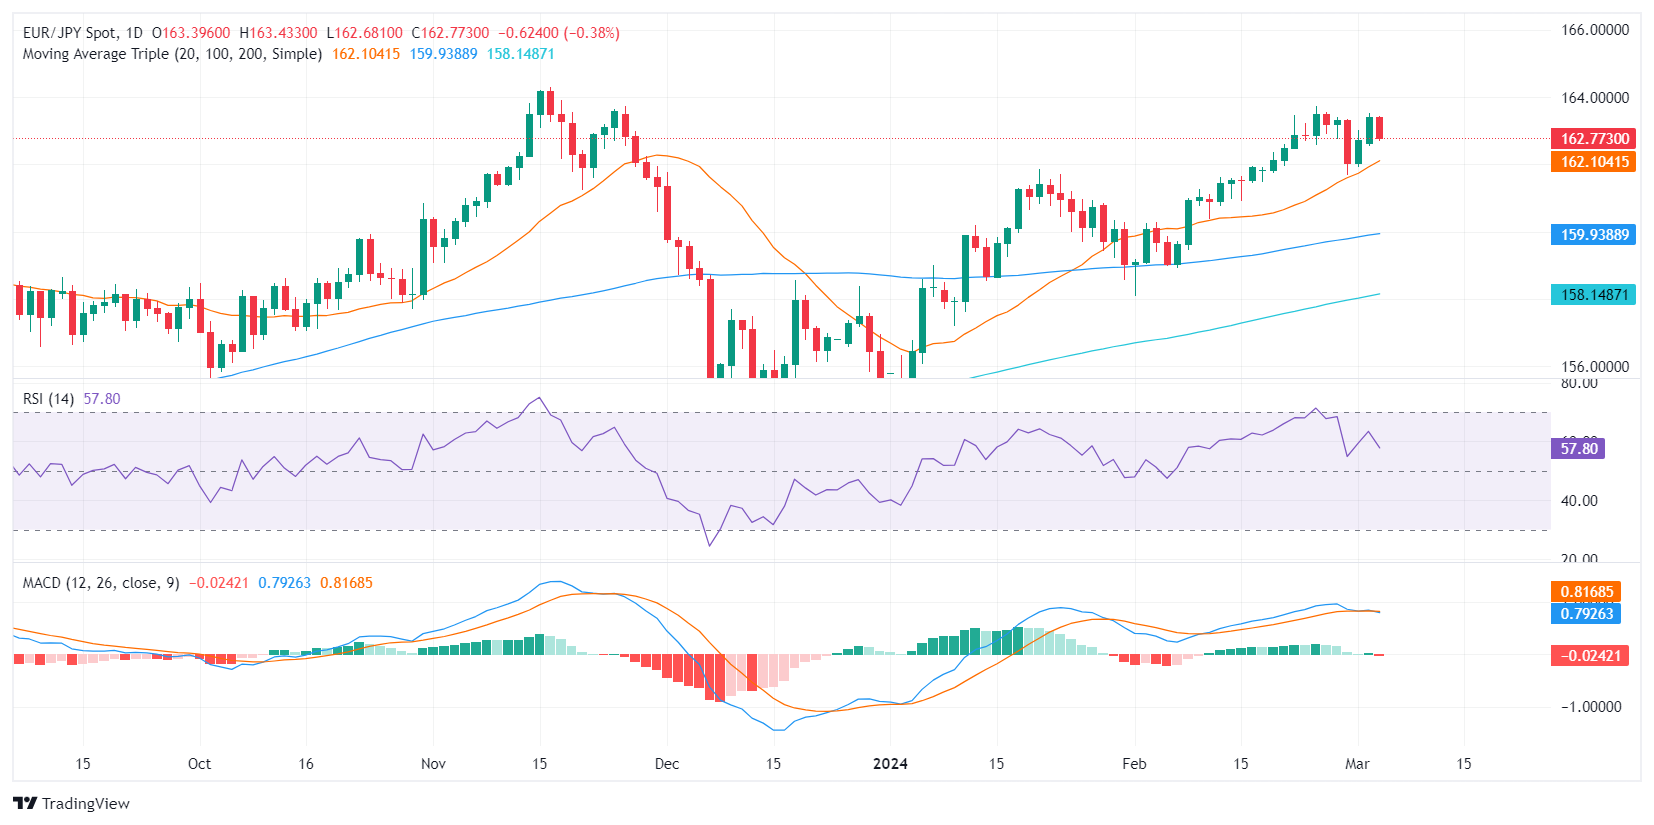
  • The daily chart reveals that buyers are consolidating the last session's gains.
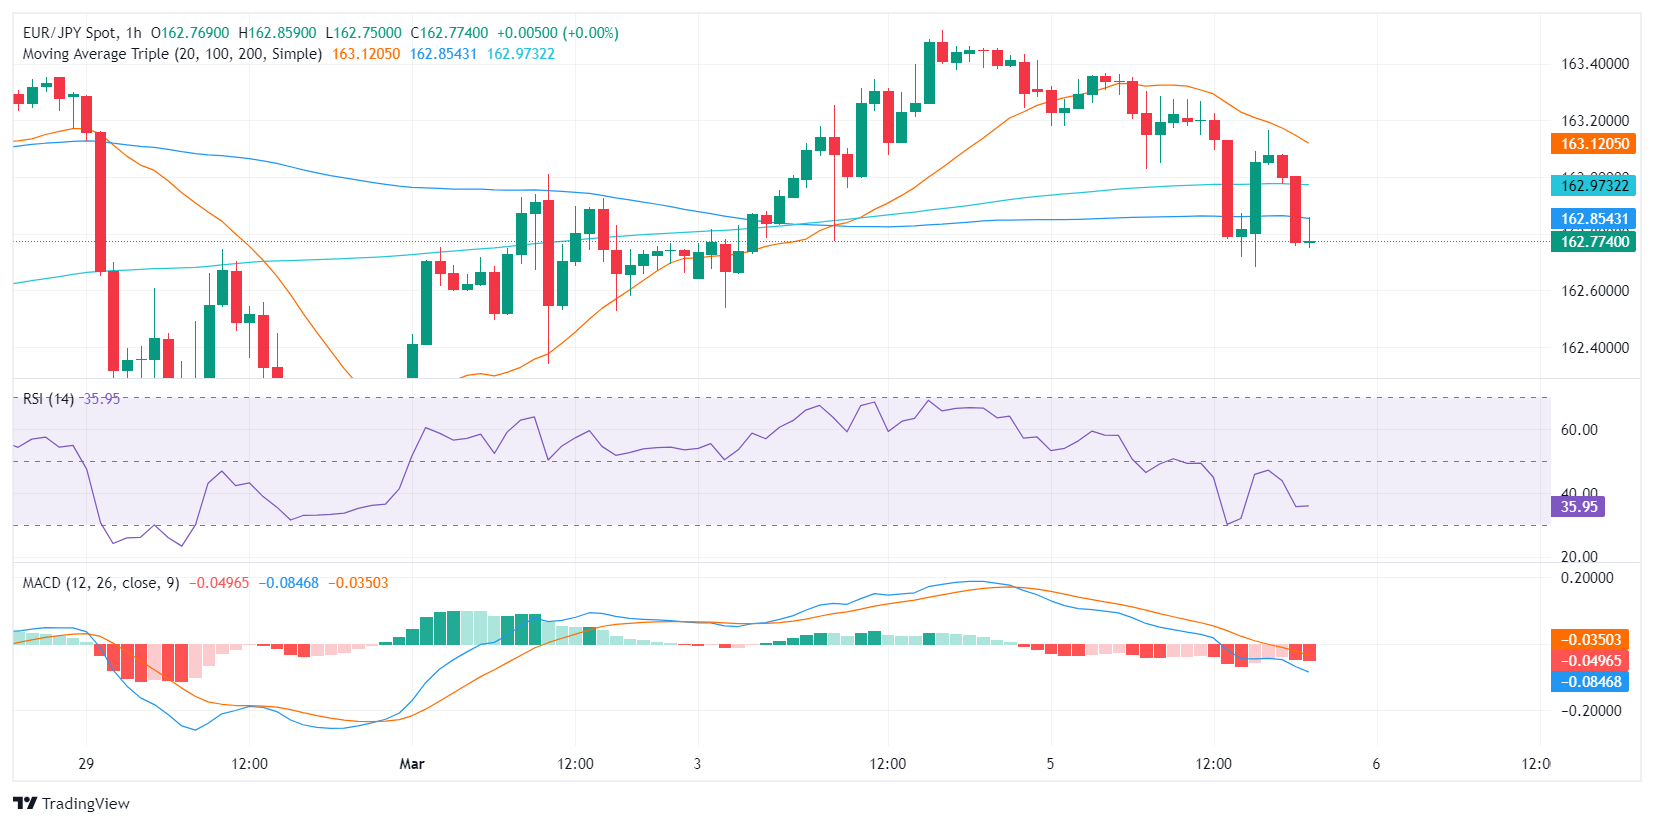
  • Hourly indicators hint at a possible shift in trend with sellers in charge, and indicators near oversold territory.

In Tuesday's session, the EUR/JPY pair is trading at 162.76, with 0.31% losses. With a larger influence by buyers compared to sellers, the broader perspective suggests a predominant bullish trend despite the day-to-day loss as the buyers seem to be taking a breather. 

On the daily chart, the Relative Strength Index (RSI) for the EUR/JPY pair is in positive territory, signaling the domination of buyers in the market but it points south. Concurrently, the Moving Average Convergence Divergence (MACD) indicates a growing selling momentum with rising red bars which corroborates the idea of a short-term downward consolidation.

EUR/JPY daily chart

Comparatively, The hourly RSI value is indicating a negative territory, with sellers dominating the market but near the 30 threshold which could suggest that for the rest of the session, the pair may continue consolidating. The hourly MACD histogram shows flat red bars, which indicates negative momentum.

EUR/JPY hourly chart

Despite the short-term negative outlook, the EUR/JPY pair is trading above its 20,100,200-day Simple Moving Averages, indicating that the long-term trend remains bullish. The negative signals from the RSI and MACD however, are that for the short term, the sellers are in charge, but to challenge the clear overall bullish trend, they need to at least conquer the 20-day SMA.

EUR/JPY

Overview
Today last price 162.76
Today Daily Change -0.64
Today Daily Change % -0.39
Today daily open 163.4
 
Trends
Daily SMA20 161.92
Daily SMA50 160.16
Daily SMA100 159.9
Daily SMA200 158.09
 
Levels
Previous Daily High 163.52
Previous Daily Low 162.54
Previous Weekly High 163.72
Previous Weekly Low 161.68
Previous Monthly High 163.72
Previous Monthly Low 158.08
Daily Fibonacci 38.2% 163.15
Daily Fibonacci 61.8% 162.91
Daily Pivot Point S1 162.78
Daily Pivot Point S2 162.17
Daily Pivot Point S3 161.8
Daily Pivot Point R1 163.77
Daily Pivot Point R2 164.13
Daily Pivot Point R3 164.75


Share: Feed news

Information on these pages contains forward-looking statements that involve risks and uncertainties. Markets and instruments profiled on this page are for informational purposes only and should not in any way come across as a recommendation to buy or sell in these assets. You should do your own thorough research before making any investment decisions. FXStreet does not in any way guarantee that this information is free from mistakes, errors, or material misstatements. It also does not guarantee that this information is of a timely nature. Investing in Open Markets involves a great deal of risk, including the loss of all or a portion of your investment, as well as emotional distress. All risks, losses and costs associated with investing, including total loss of principal, are your responsibility. The views and opinions expressed in this article are those of the authors and do not necessarily reflect the official policy or position of FXStreet nor its advertisers. The author will not be held responsible for information that is found at the end of links posted on this page.

If not otherwise explicitly mentioned in the body of the article, at the time of writing, the author has no position in any stock mentioned in this article and no business relationship with any company mentioned. The author has not received compensation for writing this article, other than from FXStreet.

FXStreet and the author do not provide personalized recommendations. The author makes no representations as to the accuracy, completeness, or suitability of this information. FXStreet and the author will not be liable for any errors, omissions or any losses, injuries or damages arising from this information and its display or use. Errors and omissions excepted.

The author and FXStreet are not registered investment advisors and nothing in this article is intended to be investment advice.

Recommended content


Recommended content

Editors’ Picks

EUR/USD flirts with daily tops near 1.0730

EUR/USD flirts with daily tops near 1.0730

The continuation of the selling pressure in the Greenback now lends further oxygen to the risk complex, encouraging EUR/USD to revisit the area of daily highs near 1.0730.

EUR/USD News

USD/JPY looks stable around 156.50 as suspicious intervention lingers

USD/JPY looks stable around 156.50 as suspicious intervention lingers

USD/JPY remains well on the defensive in the mid-156.00s albeit off daily lows, as market participants continue to digest the still-unconfirmed FX intervention by the Japanese MoF earlier in the Asian session.

USD/JPY News

Gold advances for a third consecutive day

Gold advances for a third consecutive day

Gold fluctuates in a relatively tight channel above $2,330 on Monday. The benchmark 10-year US Treasury bond yield corrects lower and helps XAU/USD limit its losses ahead of this week's key Fed policy meeting.

Gold News

Week Ahead: Bitcoin could surprise investors this week Premium

Week Ahead: Bitcoin could surprise investors this week

Two main macroeconomic events this week could attempt to sway the crypto markets. Bitcoin (BTC), which showed strength last week, has slipped into a short-term consolidation. 

Read more

Five Fundamentals for the week: Fed fears, Nonfarm Payrolls, Middle East promise an explosive week Premium

Five Fundamentals for the week: Fed fears, Nonfarm Payrolls, Middle East promise an explosive week

Higher inflation is set to push Fed Chair Powell and his colleagues to a hawkish decision. Nonfarm Payrolls are set to rock markets, but the ISM Services PMI released immediately afterward could steal the show.

Read more

Forex MAJORS

Cryptocurrencies

Signatures