EUR/JPY Price Analysis: Bullish stance holds strong, potential minor correction anticipated


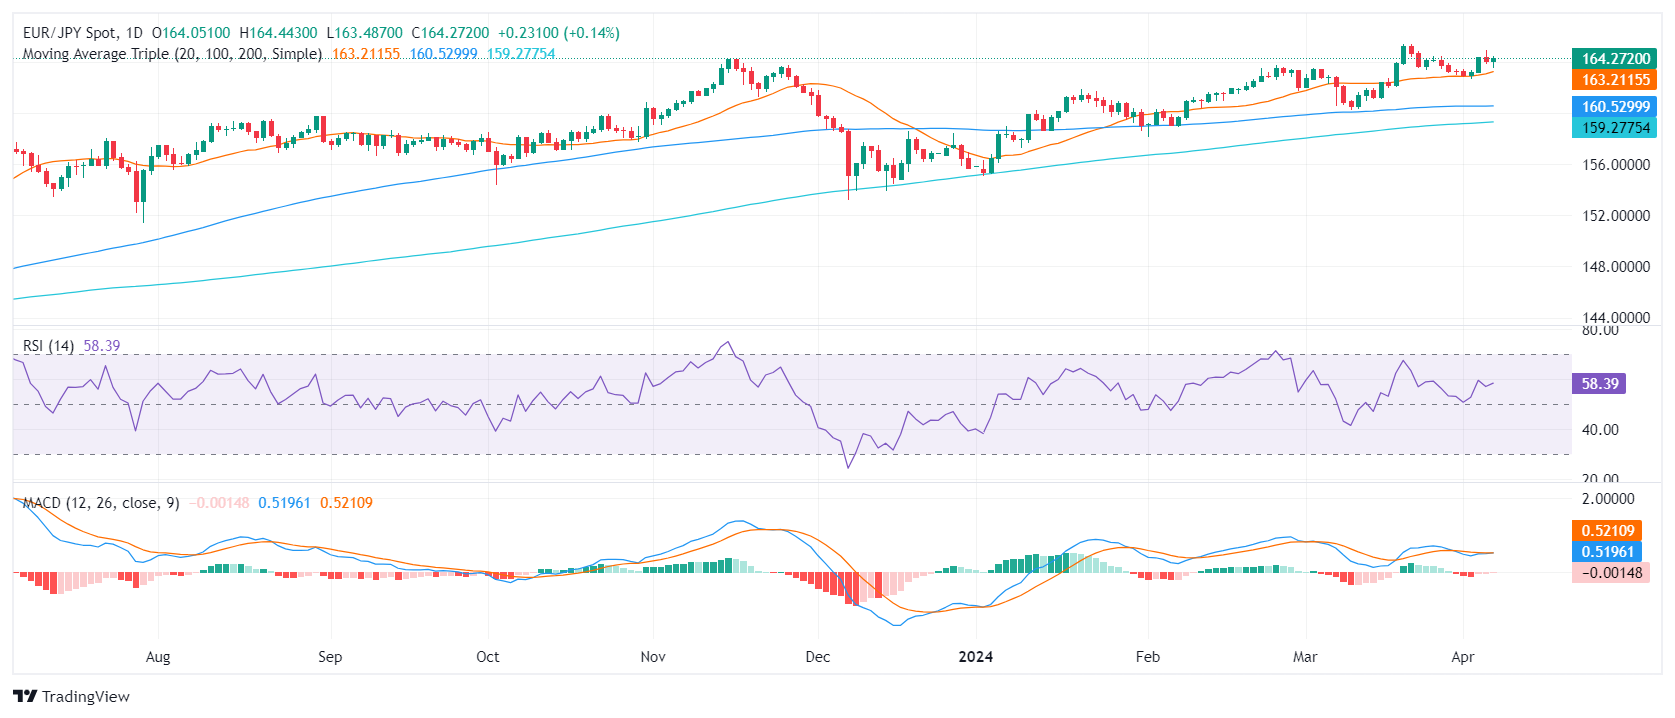
  • The daily chart reveals an encouraging picture for the bulls, with the RSI close to 60.
  • On the hourly chart, the indicators are weakening, but remain in a positive area.
  • The cross operating above main SMAs, suggests a maintained bullish bias in both short-term and long-term contexts.

The EUR/JPY pair is currently exchanging hands at 164.24, registering a minor gain of 0.16%. Trading dynamics are steadily bullish, with buyers having a dominant influence over market actions. However, indicators are losing steam in the hourly chart.

The daily Relative Strength Index (RSI) reading, residing near 60, places the market in a positive territory and its consistent positive trend in the RSI, indicates that buyers maintain control over the market. Consistently, the Moving Average Convergence Divergence (MACD) presents an encouraging picture with decreasing red bars suggesting weak negative momentum.

EUR/JPY daily chart

Taking a look at the hourly chart, a similar tone of bullish dominance resounds but with indicators losing traction. The RSI values show a positive terrain, position between 40 and 60 during the most recent hours but point south. The MACD on the other hand, prints flat green bars, indicating a steady buying momentum.

EUR/JPY hourly chart

In the broader perspective, EUR/JPY maintains a significant bullish stance. Notably, the EUR/JPY stands above both the 20,100 and 200-day SMA, reaffirming a solid long-term bullish position and confirming the dominant upward movement shown by the RSI.

In conclusion, the comprehensive examination of EUR/JPY, considering both the daily and hourly charts, delivers a dual message. Buyers generally command the market, as illustrated by the upward RSI trend and the presence of green MACD bars. However, minor dips and slowdowns on the hourly chart imply occasional shifts in market dynamics toward sellers.


EUR/JPY

Overview
Today last price 164.27
Today Daily Change 0.23
Today Daily Change % 0.14
Today daily open 164.04
 
Trends
Daily SMA20 163.04
Daily SMA50 162.1
Daily SMA100 160.52
Daily SMA200 159.24
 
Levels
Previous Daily High 164.92
Previous Daily Low 163.79
Previous Weekly High 164.42
Previous Weekly Low 162.94
Previous Monthly High 165.36
Previous Monthly Low 160.22
Daily Fibonacci 38.2% 164.22
Daily Fibonacci 61.8% 164.49
Daily Pivot Point S1 163.59
Daily Pivot Point S2 163.13
Daily Pivot Point S3 162.47
Daily Pivot Point R1 164.71
Daily Pivot Point R2 165.37
Daily Pivot Point R3 165.83


Share: Feed news

Information on these pages contains forward-looking statements that involve risks and uncertainties. Markets and instruments profiled on this page are for informational purposes only and should not in any way come across as a recommendation to buy or sell in these assets. You should do your own thorough research before making any investment decisions. FXStreet does not in any way guarantee that this information is free from mistakes, errors, or material misstatements. It also does not guarantee that this information is of a timely nature. Investing in Open Markets involves a great deal of risk, including the loss of all or a portion of your investment, as well as emotional distress. All risks, losses and costs associated with investing, including total loss of principal, are your responsibility. The views and opinions expressed in this article are those of the authors and do not necessarily reflect the official policy or position of FXStreet nor its advertisers. The author will not be held responsible for information that is found at the end of links posted on this page.

If not otherwise explicitly mentioned in the body of the article, at the time of writing, the author has no position in any stock mentioned in this article and no business relationship with any company mentioned. The author has not received compensation for writing this article, other than from FXStreet.

FXStreet and the author do not provide personalized recommendations. The author makes no representations as to the accuracy, completeness, or suitability of this information. FXStreet and the author will not be liable for any errors, omissions or any losses, injuries or damages arising from this information and its display or use. Errors and omissions excepted.

The author and FXStreet are not registered investment advisors and nothing in this article is intended to be investment advice.

Recommended content


Recommended content

Editors’ Picks

EUR/USD bounces off lows, back near 1.1330

EUR/USD bounces off lows, back near 1.1330

EUR/USD meets daily support around the 1.1300 neighbourhood, managing to regain pace and revisit the 1.1330 region. Sentiment turned after President Trump proposed a “straight 50% tariff” on European imports, undermining the pair’s bullish momentum.

GBP/USD eases from tops, revisits the 1.3500 zone

GBP/USD eases from tops, revisits the 1.3500 zone

GBP/USD benefits from broad US Dollar weakness, climbing to its highest level since February 2022 past 1.3500 at the end of the week. UK retail sales data surprised to the upside in April, lending extra wings to the quid.

Gold keeps the bullish tone near $3,350

Gold keeps the bullish tone near $3,350

Gold extends its weekly advance, trading around $3,350 per troy ounce on Friday. The rally in XAU/USD is driven by broad-based weakness in the Greenback, particulalry after President Trump’s threat to impose 50% tariffs on European imports.

Apple stock sinks below $200 after Trump threatens more tariffs

Apple stock sinks below $200 after Trump threatens more tariffs Premium

Trump grows irate at Apple's move into India. President claims Apple must produce US-sold iPhone in US or face a 25% tariff. US equity futures slip more than 1% in Friday premarket after Trump threatens the EU with a 50% tariff.

Ripple Price Prediction: Whale accumulation sparks hope as rising exchange reserves signal caution

Ripple Price Prediction: Whale accumulation sparks hope as rising exchange reserves signal caution

XRP sustains mid-week recovery as XRP/BTC flashes golden cross for the first time since 2017. Large volume holders increase XRP exposure, indicating rising demand and investor confidence.

The Best brokers to trade EUR/USD

The Best brokers to trade EUR/USD

SPONSORED Discover the top brokers for trading EUR/USD in 2025. Our list features brokers with competitive spreads, fast execution, and powerful platforms. Whether you're a beginner or an expert, find the right partner to navigate the dynamic Forex market.

Forex MAJORS

Cryptocurrencies

Signatures

Best Brokers of 2025