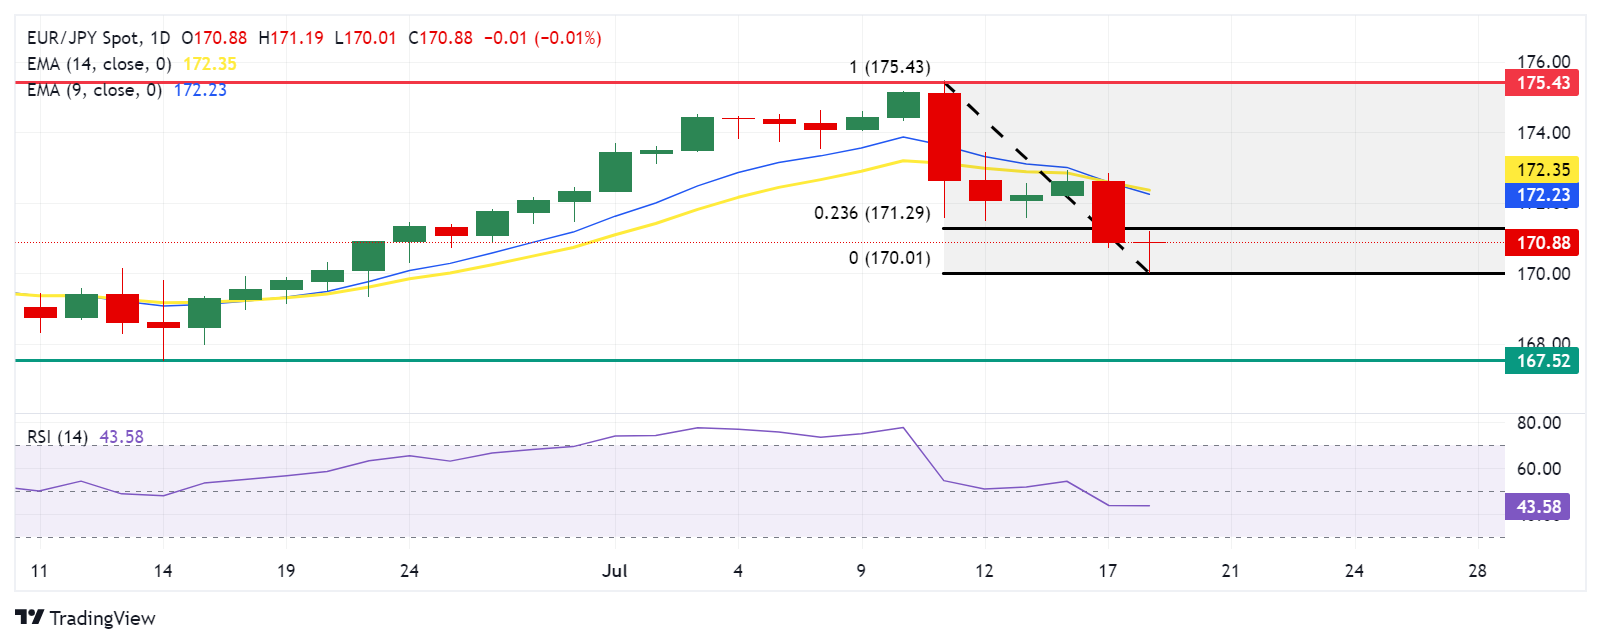
EUR/JPY Price Analysis: Appreciates to near 171.00; next barrier at 23.6% Fibonacci level
- EUR/JPY resists at 171.00 level followed by the 23.6% Fibonacci retracement at 171.29 level.
- The cross lies below 9-day EMA, indicating to refrain from buying until the trend shows signs of reversal.
- A break below the 170.00 level could lead the cross to revisit June’s low at 167.52 level.

EUR/JPY edges higher to near 170.90 during the Asian session on Thursday. The daily chart analysis shows that the pair lies below its 9-day Exponential Moving Average (EMA), suggesting downward momentum in the short term. This signals that it may be prudent to hold off on buying until the trend shows signs of reversal.
Moreover, the 14-day Relative Strength Index (RSI), a momentum indicator, is below the 50 level, suggesting a confirmation of a bearish bias for the EUR/JPY cross.
The EUR/JPY cross is likely to test the immediate resistance at the psychological level of 171.00, followed by the 23.6% Fibonacci retracement level at 171.29, positioned between the coordinates of 175.43 and 170.01 levels.
Further barrier appears at the 14-day Exponential Moving Average (EMA) at 172.36 level. A breakthrough above this level could lead the EUR/JPY cross to approach the record high of 175.43 level recorded on July 11.
On the downside, the psychological level of 170.00 could act as immediate support. A break below this level could exert downward pressure on the EUR/JPY cross to navigate the area around June’s low at 167.52 level.
EUR/JPY: Daily Chart
Euro PRICE Today
The table below shows the percentage change of Euro (EUR) against listed major currencies today. Euro was the strongest against the Swiss Franc.
| USD | EUR | GBP | JPY | CAD | AUD | NZD | CHF | |
|---|---|---|---|---|---|---|---|---|
| USD | 0.04% | 0.02% | 0.06% | -0.02% | -0.13% | 0.11% | 0.12% | |
| EUR | -0.04% | -0.02% | 0.02% | -0.06% | -0.18% | 0.07% | 0.08% | |
| GBP | -0.02% | 0.02% | 0.04% | -0.05% | -0.14% | 0.11% | 0.10% | |
| JPY | -0.06% | -0.02% | -0.04% | -0.09% | -0.19% | 0.03% | 0.06% | |
| CAD | 0.02% | 0.06% | 0.05% | 0.09% | -0.11% | 0.14% | 0.14% | |
| AUD | 0.13% | 0.18% | 0.14% | 0.19% | 0.11% | 0.26% | 0.28% | |
| NZD | -0.11% | -0.07% | -0.11% | -0.03% | -0.14% | -0.26% | -0.00% | |
| CHF | -0.12% | -0.08% | -0.10% | -0.06% | -0.14% | -0.28% | 0.00% |
The heat map shows percentage changes of major currencies against each other. The base currency is picked from the left column, while the quote currency is picked from the top row. For example, if you pick the Euro from the left column and move along the horizontal line to the US Dollar, the percentage change displayed in the box will represent EUR (base)/USD (quote).
Author

Akhtar Faruqui
FXStreet
Akhtar Faruqui is a Forex Analyst based in New Delhi, India. With a keen eye for market trends and a passion for dissecting complex financial dynamics, he is dedicated to delivering accurate and insightful Forex news and analysis.


