|

EUR/JPY Price Analysis: A drop to the 200-day SMA is not ruled out

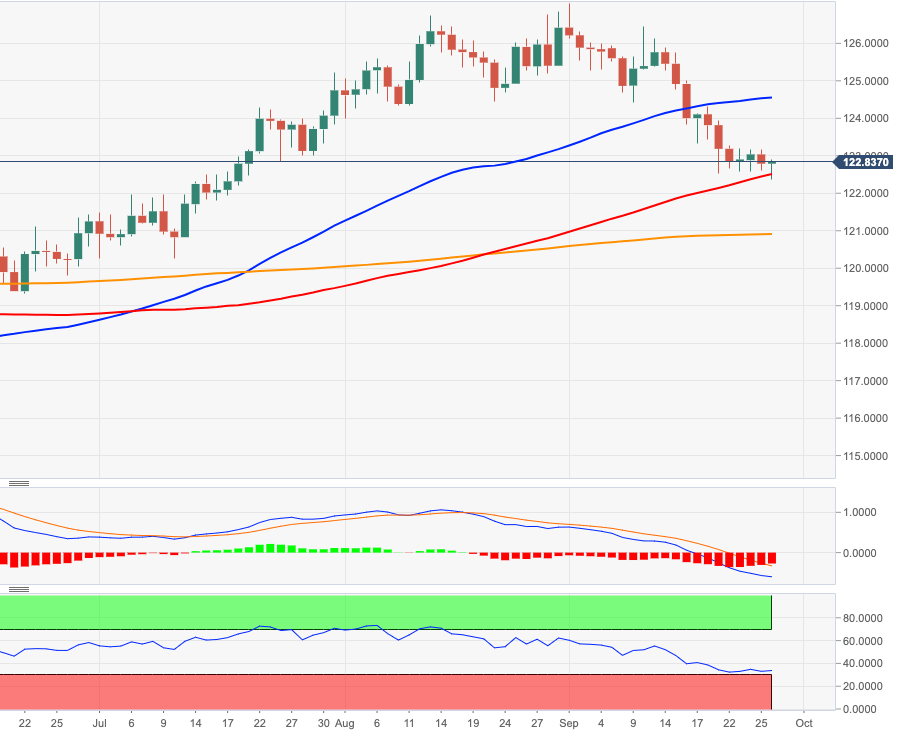
  • EUR/JPY remains within a consolidative range below the 123.00 mark.
  • The resumption of the selling bias could see the 200-day SMA retested.

EUR/JPY still navigates within a side-lined mood in the sub-123.00 region so far on Monday.

The recent selling pressure seems to have met decent contention in the vicinity of 122.40 on Monday, where also lies the 100-day SMA. If cleared, the critical 200-day SMA, today at 120.88, should return to the investors’ radar.

Below the 200-day SMA the outlook on the cross is expected to shift to bearish.

EUR/JPY daily chart

EUR/JPY

Overview
Today last price122.82
Today Daily Change51
Today Daily Change %0.02
Today daily open122.79
 
Trends
Daily SMA20124.71
Daily SMA50124.78
Daily SMA100122.45
Daily SMA200120.91
 
Levels
Previous Daily High123.16
Previous Daily Low122.61
Previous Weekly High123.94
Previous Weekly Low122.52
Previous Monthly High126.85
Previous Monthly Low123.99
Daily Fibonacci 38.2%122.82
Daily Fibonacci 61.8%122.95
Daily Pivot Point S1122.55
Daily Pivot Point S2122.31
Daily Pivot Point S3122.01
Daily Pivot Point R1123.09
Daily Pivot Point R2123.4
Daily Pivot Point R3123.64

Author

Pablo Piovano

Born and bred in Argentina, Pablo has been carrying on with his passion for FX markets and trading since his first college years.

More from Pablo Piovano
Share:

Editor's Picks

EUR/USD keeps the offered stance just above 1.1700

EUR/USD is coming under heavy selling pressure in what has been a rather grim start to the new trading week, with the pair now trading close to the 1.1700 support area as the US Dollar stages a solid rebound. The prevailing flight to safety mood continues to favour the Greenback, as investors react to the escalating conflict in the Middle East and trim risk exposure across the board.

GBP/USD hits new yearly lows near 1.3300

GBP/USD adds to the recent bearish tone, approaching to the key 1.3300 support to reach fresh YTD troughs against the backdrop of the robust performance of the US Dollar. Indeed, Cable’s decline comes amid the firm demand for the safe-haven space in the wake of the US and Israel attacks to Iran.

Gold trims losses, back below $5,400

Gold now surrenders part of the earlier advance past the $5,400 mark per troy ounce at the beginning of the week. Indeed, the precious metal’s strong uptick remains fuelled by increasing geopolitical tensions in the Middle East amid the intense demand for safer assets.

Bitcoin on brink of breakdown amid US-Iran war

Bitcoin (BTC) remains under pressure near the key support level of $65,700. Trading at $66,400 at the time of writing on Monday, a breakdown below this critical level would suggest a deeper correction ahead.

The Fed is finally talking about AI – Here's why it matters for the US Dollar

AI is moving from earnings calls into the heart of monetary policy discussions, forcing Federal Reserve officials to confront a new question: How to act if AI reshapes inflation, employment and interest rates at the same time?

Grass 20% bullish breakout defies broader market weakness

Grass (GRASS) is edging up above $0.30 at the time of writing on Monday. The token’s notable 20% intraday surge stands out amid heightened volatility in the broader crypto market.