EUR/GBP Technical Analysis: Euro reaches multi-week highs at 0.8820 against Pound

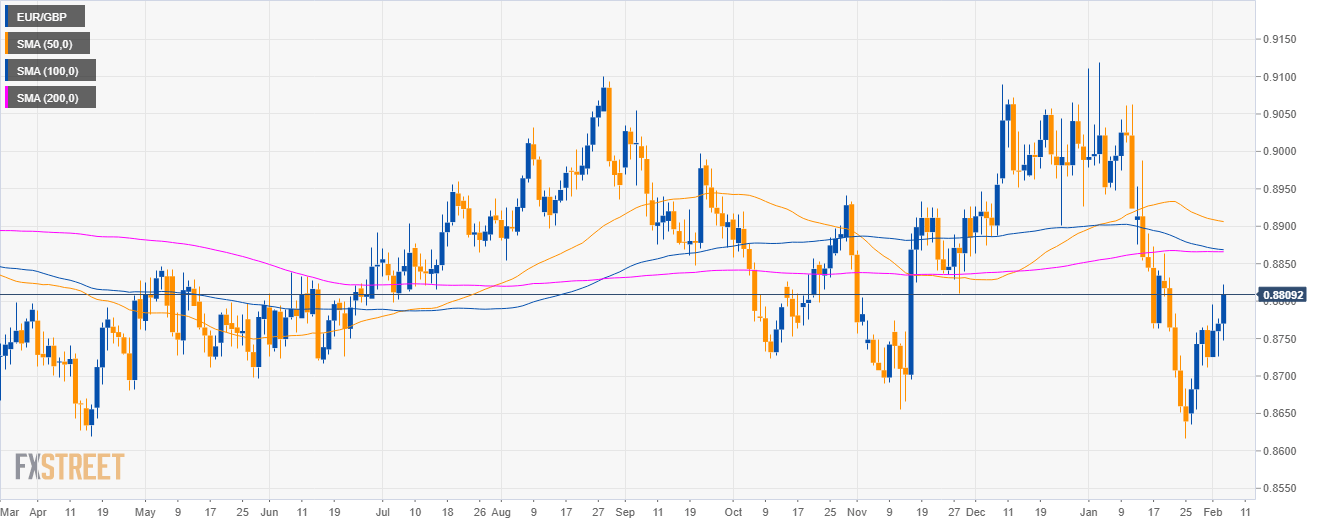
EUR/GBP daily chart
- EUR/GBP is trading in a sideways trend below the 200-day simple moving averages (SMAs).
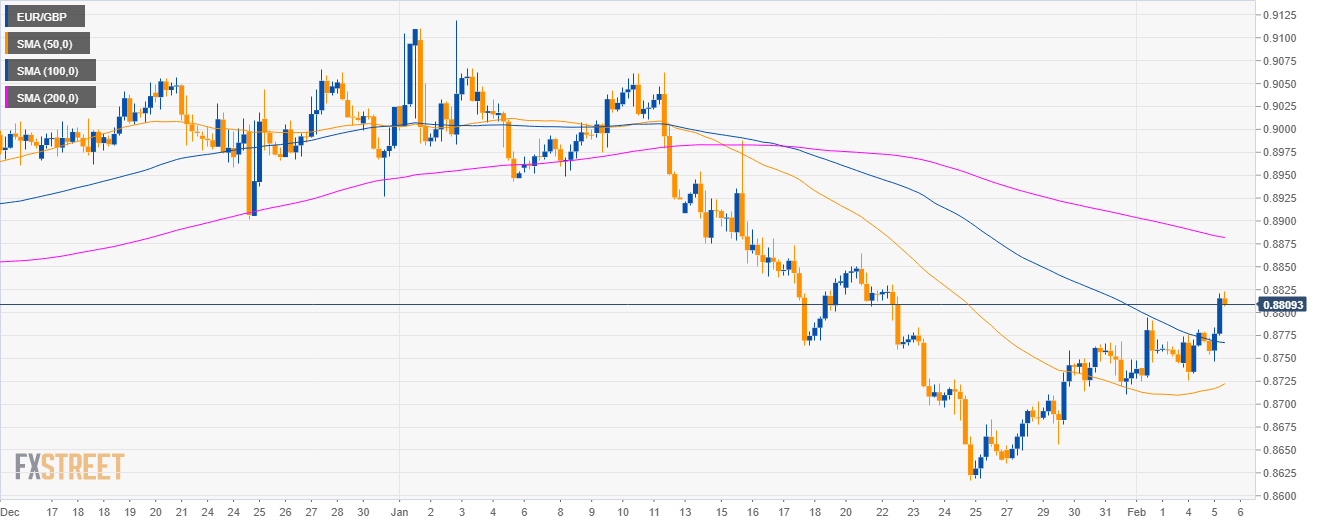
EUR/GBP 4-hour chart
- EUR/GBP is trading below the 100 SMA on the 4-hour chart.
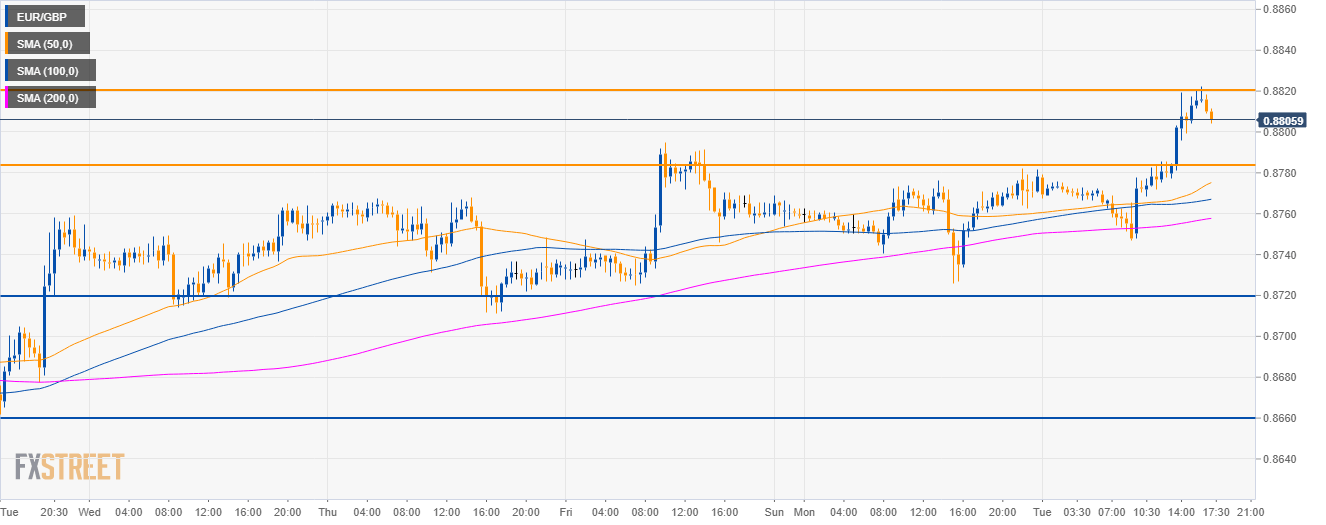
EUR/GBP 30-minute chart
- EUR/GBP is finding resistance at the 0.8820 level.
- If EUR/GBP stays below 0.8820, support to the downside is now seen at the 0.8785 level.
Additional key levels
EUR/GBP
Overview:
Today Last Price: 0.881
Today Daily change: 40 pips
Today Daily change %: 0.46%
Today Daily Open: 0.877
Trends:
Daily SMA20: 0.8811
Daily SMA50: 0.8907
Daily SMA100: 0.8869
Daily SMA200: 0.8866
Levels:
Previous Daily High: 0.8776
Previous Daily Low: 0.8726
Previous Weekly High: 0.8795
Previous Weekly Low: 0.8636
Previous Monthly High: 0.9119
Previous Monthly Low: 0.8617
Daily Fibonacci 38.2%: 0.8757
Daily Fibonacci 61.8%: 0.8745
Daily Pivot Point S1: 0.8738
Daily Pivot Point S2: 0.8707
Daily Pivot Point S3: 0.8688
Daily Pivot Point R1: 0.8789
Daily Pivot Point R2: 0.8808
Daily Pivot Point R3: 0.8839
Author

Flavio Tosti
Independent Analyst


