|

EUR/GBP technical analysis: Euro has room to the upside against Sterling

  • EUR/GBP is finding some footing near the October lows.
  • The level to beat for bulls is the 0.8680 resistance. 
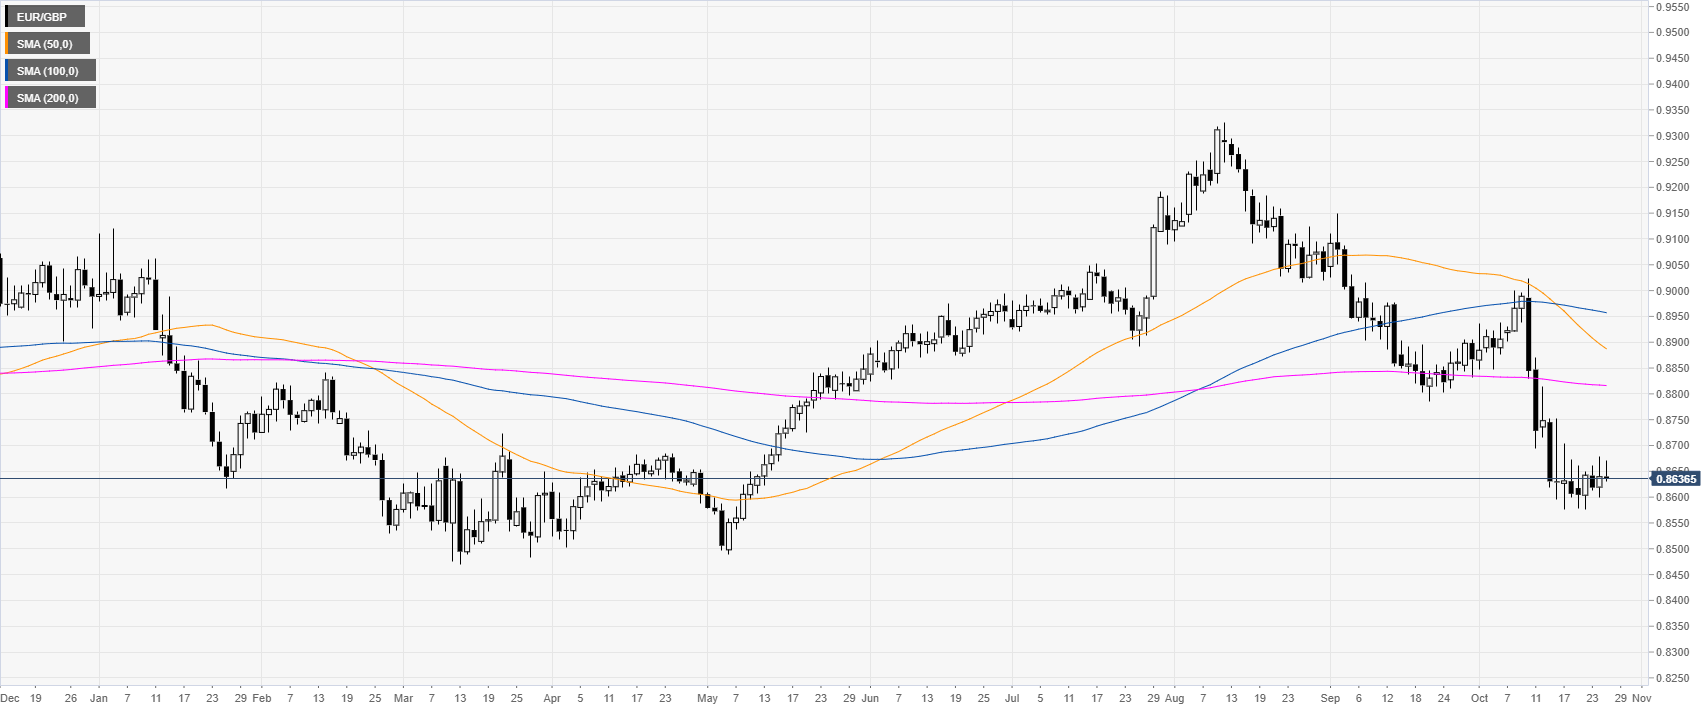
 

EUR/GBP daily chart


EUR/GBP, on the daily chart, is trading in a downtrend below its main daily simple moving averages (DMAs). In the last weeks of trading, the euphoria of a Brexit deal sent the market below the 0.8600 handle. 

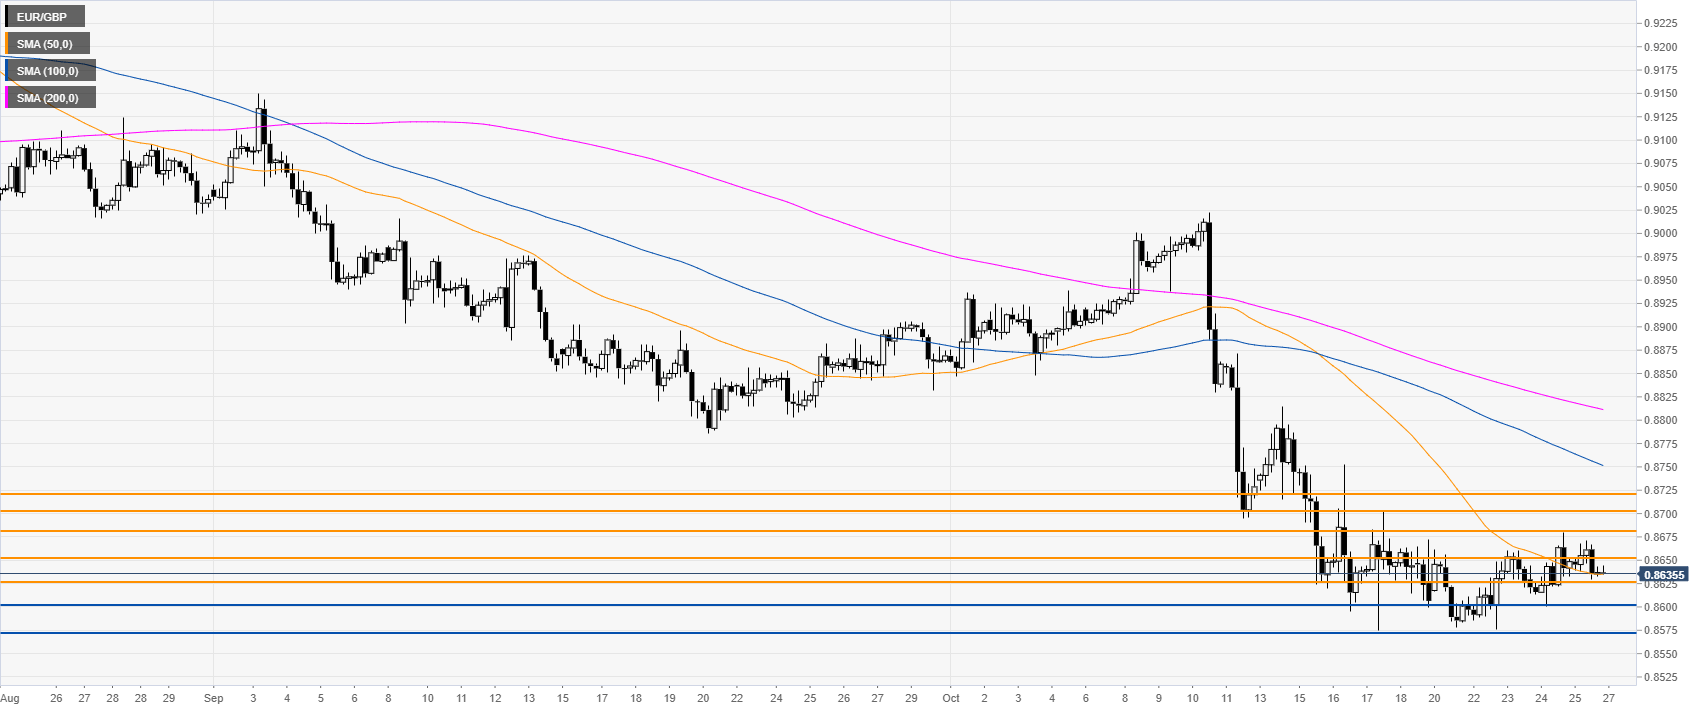
EUR/GBP four-hour chart


EUR/GBP is trading below the 100 and 200 SMAs, suggesting a bearish bias in the medium term. In the medium term horizon, only a daily close below the 0.8575 support can potentially lead the market to the 0.8500 handle, according to the Technical Confluences Indicator. 


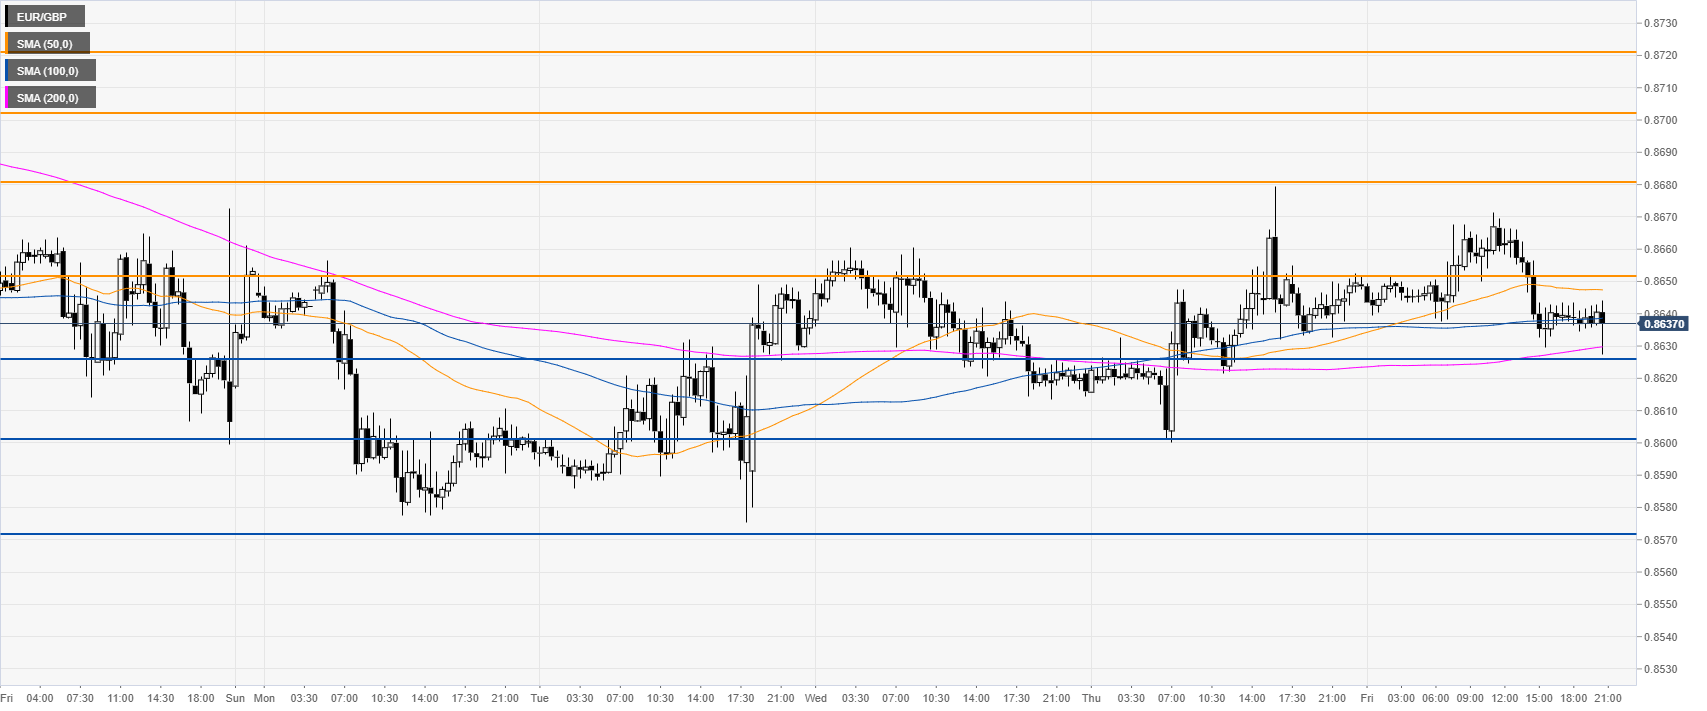
EUR/GBP 30-minute chart


EUR/GBP is trading above its 200 SMA, suggesting a bullish bias in the near term. Next week bulls can try to reach the 0.8680, 0.8700 and 0.8720 on the way up, according to the Technical Confluences Indicator. 
 

Additional key levels

EUR/GBP

Overview
Today last price0.864
Today Daily Change0.0000
Today Daily Change %0.00
Today daily open0.864
 
Trends
Daily SMA200.8778
Daily SMA500.8897
Daily SMA1000.896
Daily SMA2000.8817
 
Levels
Previous Daily High0.868
Previous Daily Low0.86
Previous Weekly High0.8814
Previous Weekly Low0.8575
Previous Monthly High0.915
Previous Monthly Low0.8786
Daily Fibonacci 38.2%0.8649
Daily Fibonacci 61.8%0.863
Daily Pivot Point S10.86
Daily Pivot Point S20.856
Daily Pivot Point S30.852
Daily Pivot Point R10.8679
Daily Pivot Point R20.8719
Daily Pivot Point R30.8759

Author

Flavio Tosti

Flavio Tosti

Independent Analyst


More from Flavio Tosti
Share:

Editor's Picks

EUR/USD flirts with weekly lows near 1.1770

EUR/USD now comes under further selling pressure, breaking below the 1.1800 support to challenge the area of weekly throughs near 1.1770 on Thursday. The pair’s decline comes in response to marked gains in the US Dollar amid steady geopolitical tensions. Ealier in the day, the ECB’s Lagarde delivered cautious remarks, although the currency remained apathetic.

GBP/USD threatens the 200-day SMA near 1.3440

GBP/USD rapidly leaves behind Wednesday’s strong advance, coming under heavy pressure and retesting the 1.3440 zone, where the critical 200-day SMA is located. Cable’s deep pullback follows the strong gains in the Greenback, while investors continue to pencil in a potential BoE rate cut in March.

Gold trims gains, slips back to around $5,170

Gold is now facing some downside pressure, hovering around the $5,170 region on Thursday. The yellow metal surrenders part of its earlier gains on the back of the resurgence of the buying interest in the Greenback. In the meantime, geopolitical tensions in the Middle East continue to limit the downside potential for now.

Stellar: Relief bounce fades as bearish undertone persists

Stellar is trading around $0.16 at the time of writing on Thursday after rebounding more than 8% in the previous day. Derivatives data paints a negative picture as XLM’s short bets hit a monthly high while Open Interest continues to decline.

Changing the game: International implications of recent tariff developments

The Supreme Court ruling on International Emergency Economic Powers Act (IEEPA) tariffs provides limited relief for the rest of the world, with weighted average tariff rates modestly lower.

Bitcoin steadies as traders eye US–Iran talks

Bitcoin (BTC) price is stabilizing around $68,000 at the time of writing on Thursday after a 6.2% relief rally the previous day amid a broader downward trend.