|

EUR/GBP technical analysis: Euro decelerates against the Pound to 0.8930

  • EUR/GBP retraces down to the 0.8912 support and the 200 SMA on the 30-minute chart.
  • The level to beat for bulls is 0.8951 and 0.8969 according to the Technical Confluences Indicator.
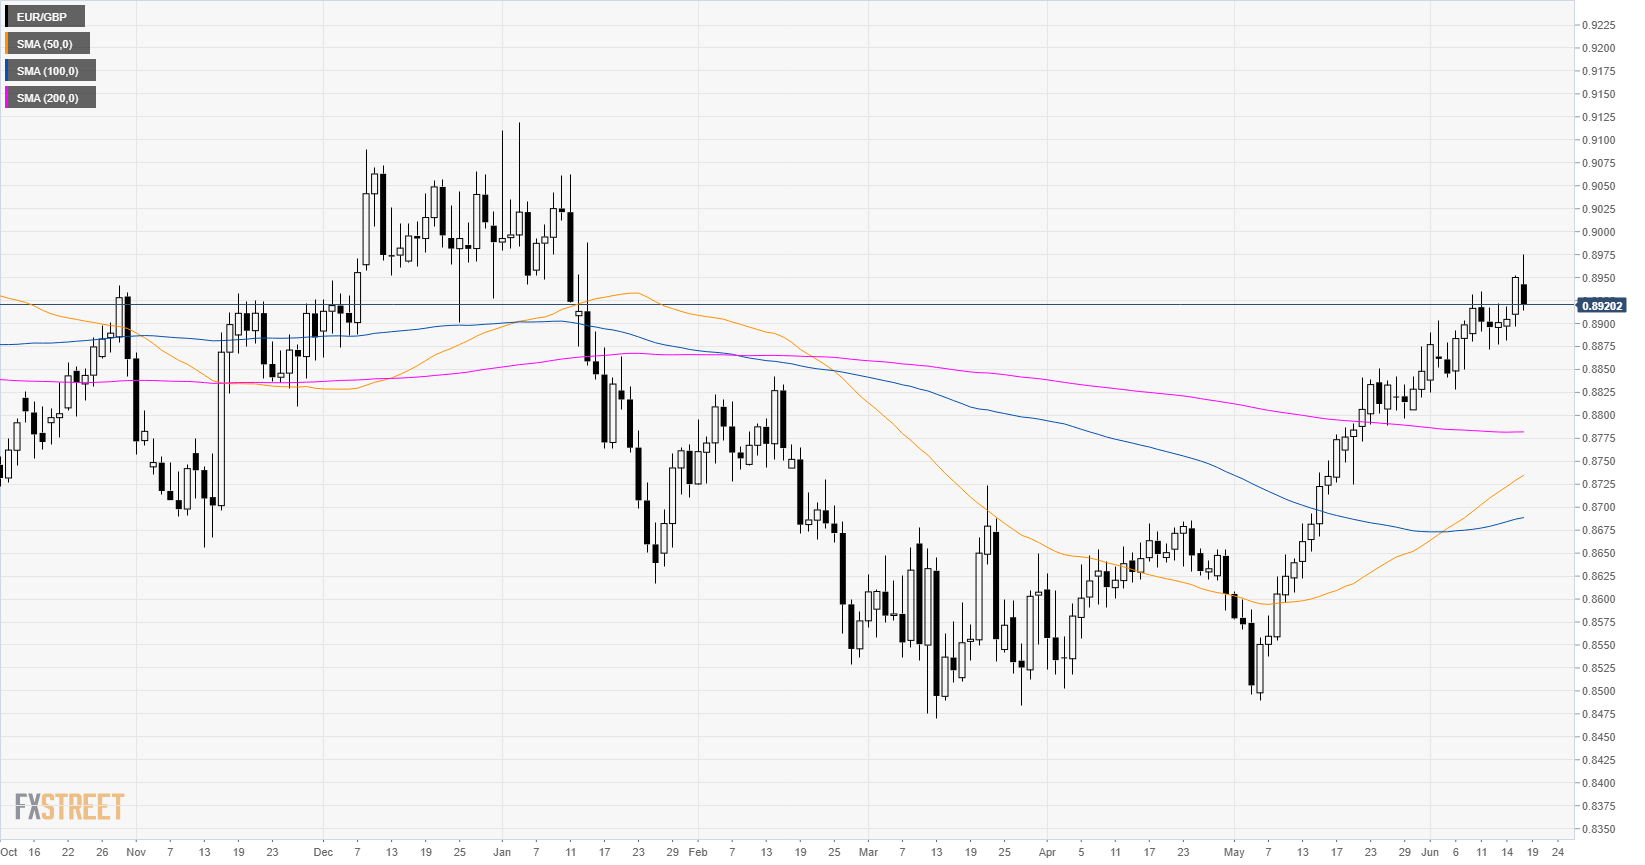
EUR/GBP daily

EUR/GBP is in a bull trend above its main simple moving averages (SMAs). The market attempted to break above Monday high but is currently under pressure on an intraday basis.

EUR/GBP 4-hour chart


The bull channel is intact above the main simple moving averages (SMAs). The market is currently pulling back towards 0.8900 and the 50 SMA.

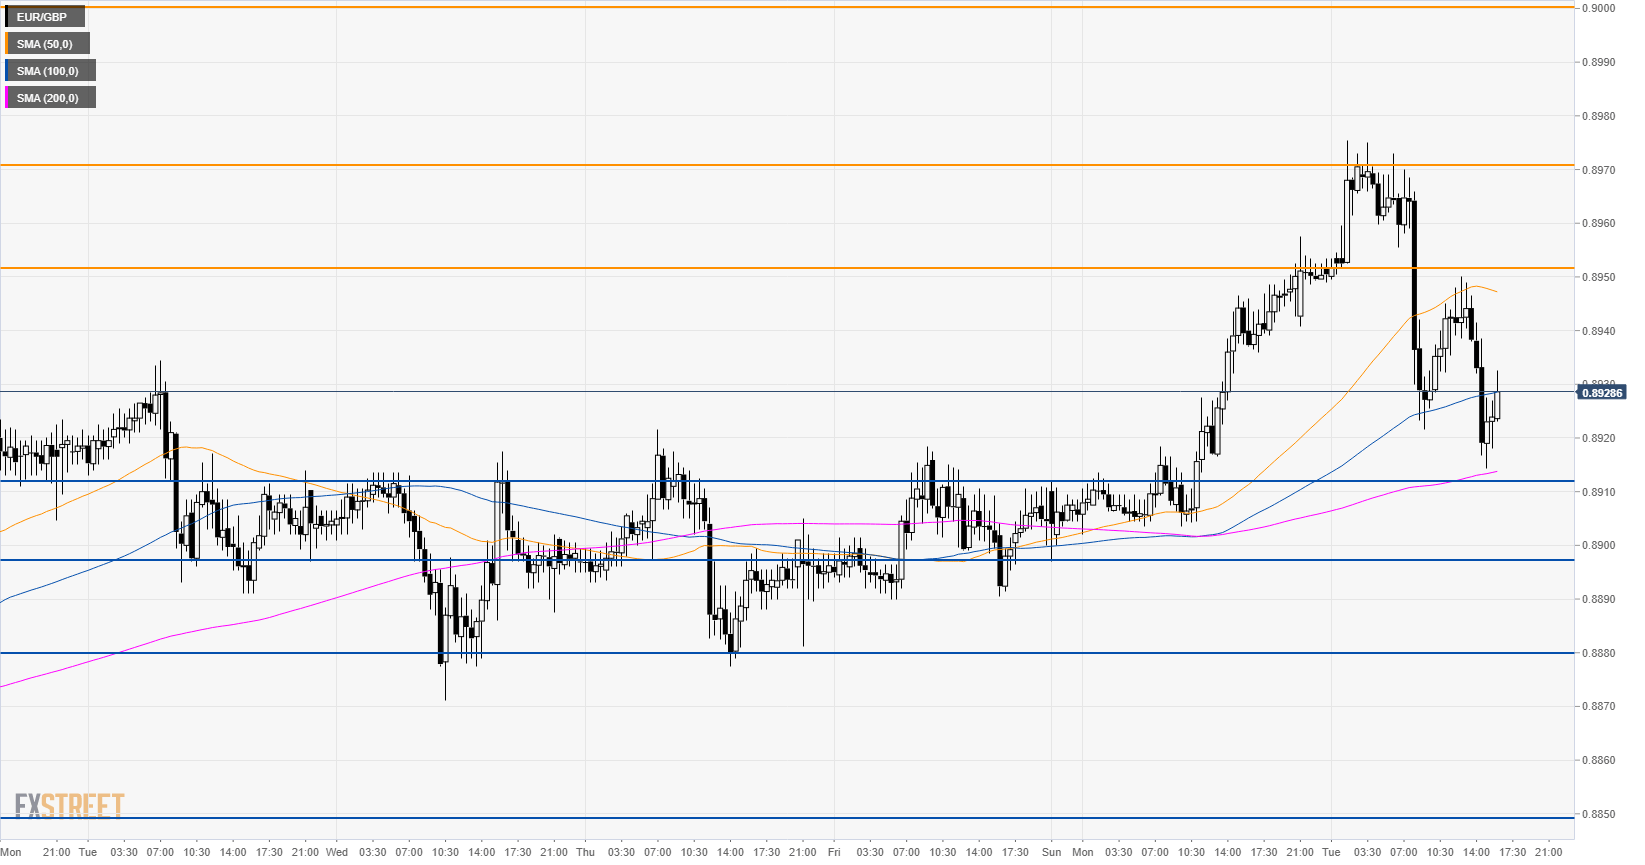
EUR/GBP 30-minute chart

EUR/GBP is trading above 0.8912 support and its main SMA suggesting bullish momentum. According to the Technical Confluences Indicator, 0.8912 is a cluster level with the 50 SMA on the 4-hour chart, the weekly Fibonacci of 38.2% and the 5 SMA on the daily chart. Further down lies 0.8897 (the weekly Fibonacci of 61.8%, the 10-day SMA and the previous day low). Strong support is seen at 0.8878 (100 SMA on the 4-hour chart, previous month high and daily Pivot Point S2.) 

Resistance is seen at 0.8951 (the 100 SMA on the 15-minute chart, the upper Bollinger Band on the daily chart and 15-minute chart). Further up, strong resistance is seen at 0.8969 (the weekly Pivot Point R2 and the daily Pivot Point R1).

Additional key levels

EUR/GBP

Overview
Today last price0.8926
Today Daily Change-0.0024
Today Daily Change %-0.27
Today daily open0.895
 
Trends
Daily SMA200.8861
Daily SMA500.8729
Daily SMA1000.8687
Daily SMA2000.8782
Levels
Previous Daily High0.8952
Previous Daily Low0.8897
Previous Weekly High0.8934
Previous Weekly Low0.8871
Previous Monthly High0.8876
Previous Monthly Low0.8489
Daily Fibonacci 38.2%0.8931
Daily Fibonacci 61.8%0.8918
Daily Pivot Point S10.8914
Daily Pivot Point S20.8878
Daily Pivot Point S30.8858
Daily Pivot Point R10.8969
Daily Pivot Point R20.8989
Daily Pivot Point R30.9025

Author

Flavio Tosti

Flavio Tosti

Independent Analyst


More from Flavio Tosti
Share:

Editor's Picks

EUR/USD accelerates losses, focus is on 1.1800

EUR/USD’s selling pressure is gathering pace now, opening the door to a potential test of the key 1.1800 region sooner rather than later. The pair’s pullback comes on the back of marked gains in the US Dollar following US data releases and the publication of the FOMC Minutes later in the day.

GBP/USD turns negative near 1.3540

GBP/USD reverses its initial upside momentum and is now adding to previous declines, revisiting at the same time the 1.3540 region on Wednesday. Cable’s downtick comes on the back of decent gains in the Greenback and easing UK inflation figures, which seem to have reinforced the case for a BoE rate cut in March.

Gold picks pace, flirts with $5,000

Gold is back on the front foot on Wednesday, shaking off part of the early week softness and pushing higher towards the key $5,000 mark per troy ounce. The move comes ahead of the FOMC Minutes and is unfolding despite an intense rebound in the US Dollar.

Fed Minutes to shed light on January hold decision amid hawkish rate outlook

The Minutes of the Fed’s January 27-28 monetary policy meeting will be published today. Details of discussions on the decision to leave the policy rate unchanged will be scrutinized by investors.

Mixed UK inflation data no gamechanger for the Bank of England

Food inflation plunged in January, but service sector price pressure is proving stickier. We continue to expect Bank of England rate cuts in March and June. The latest UK inflation read is a mixed bag for the Bank of England, but we doubt it drastically changes the odds of a March rate cut.

Sui extends sideways action ahead of Grayscale’s GSUI ETF launch

Sui is extending its downtrend for the second consecutive day, trading at 0.95 at the time of writing on Wednesday. The Layer-1 token is down over 16% in February and approximately 34% from the start of the year, aligning with the overall bearish sentiment across the crypto market.