|
EUR/GBP technical analysis: Euro bears eyeing a break below the 0.8600 handle
- EUR/GBP is at daily lows as EUR is on the back foot across the board.
- The level to beat for bears is the 0.8600 figure.
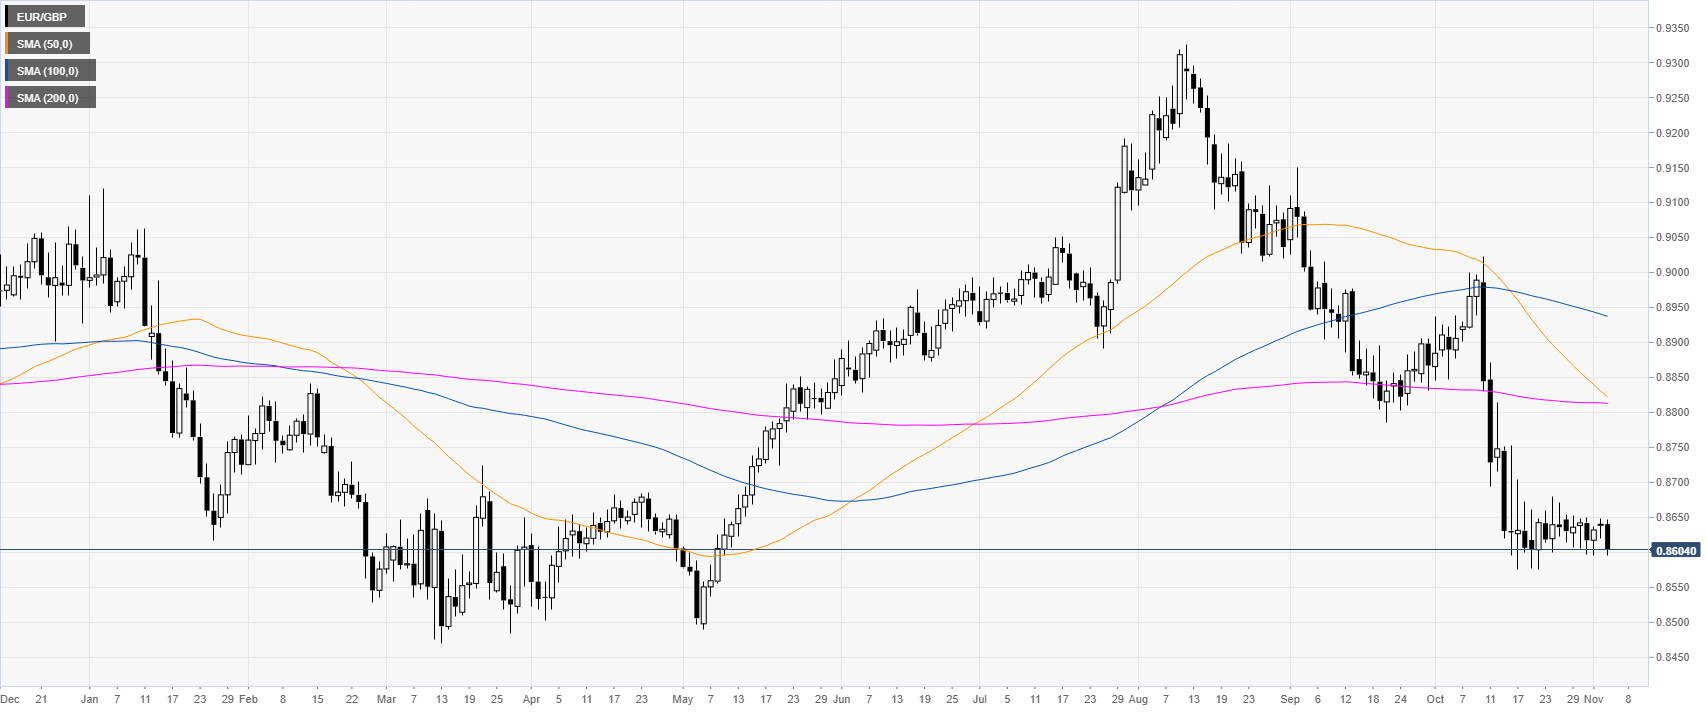
EUR/GBP daily chart
On the daily chart, EUR/GBP is trading in a bear trend below the main daily simple moving averages (DMAs). Over the last weeks of trading, the optimism of a Brexit deal drove the spot near the 0.8600 figure. This Tuesday, the EUR is losing ground against most currencies.
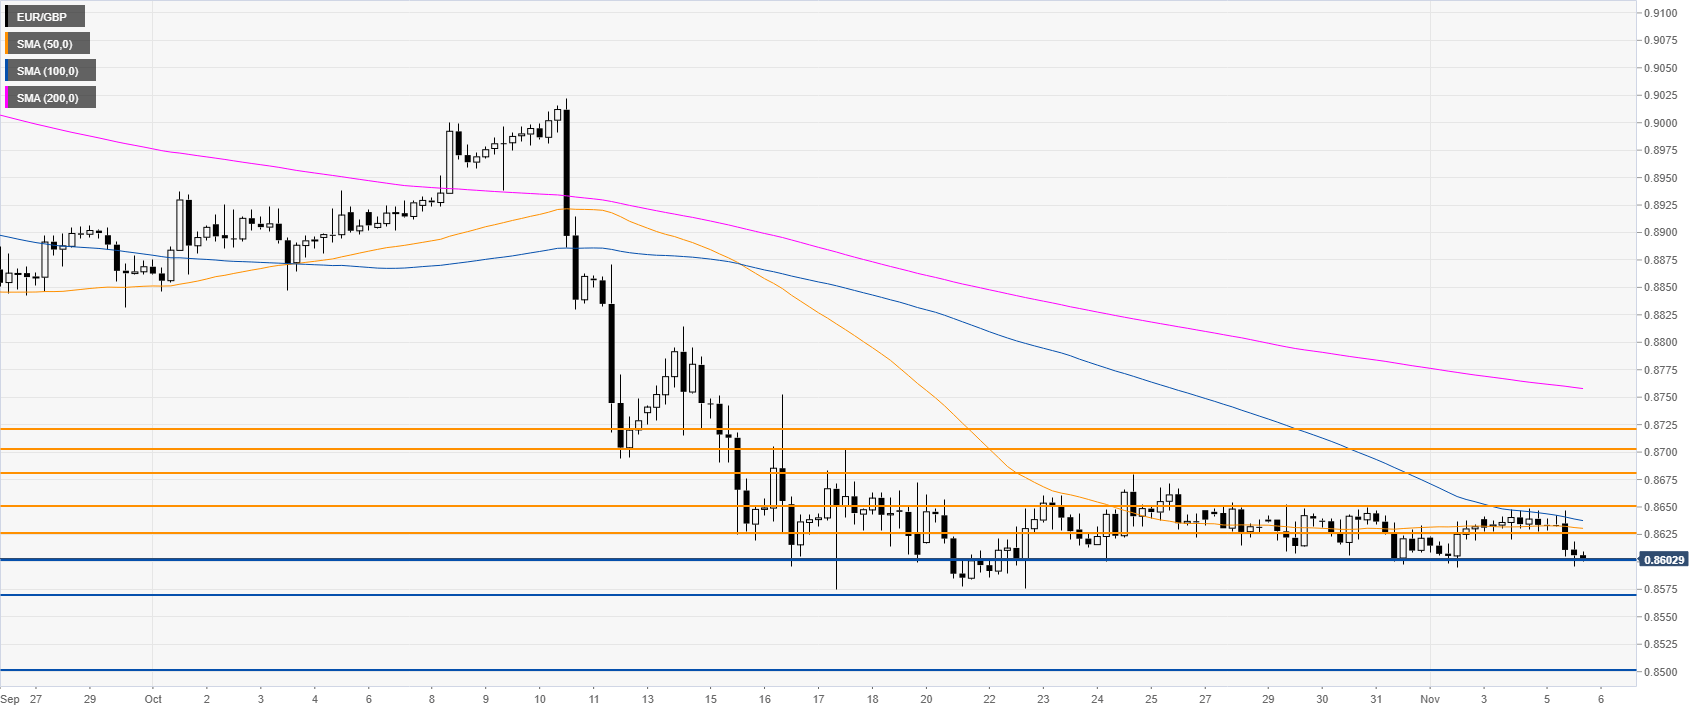
EUR/GBP four-hour chart
EUR/GBP is trading below its main SMAs, on the four-hour chart, suggesting a bearish bias in the medium term. A daily close below the 0.8575 support level would likely lead the spot to the 0.8500 round number on the way down, according to the Technical Confluences Indicator.
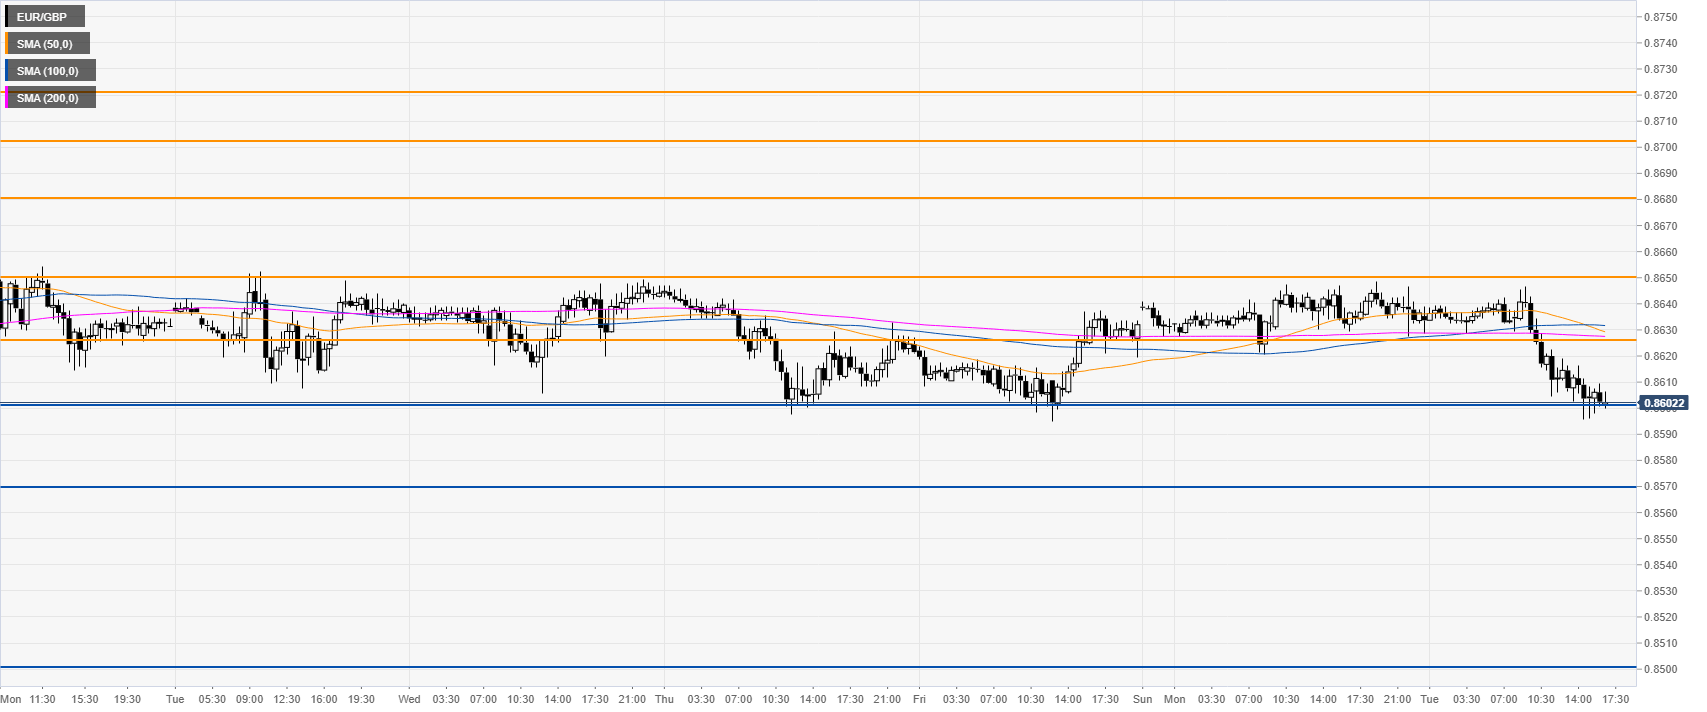
EUR/GBP 30-minute chart
EUR/GBP is ranging, trading currently below its main SMAs. The market found some support at the 0.8600 handle. A break below it can lead to 0.8570 and the 0.8500 figure. Resistance is seen at 0.8626 and 0.8650 price levels.
Additional key levels
Author

Flavio Tosti
Independent Analyst
More from Flavio Tosti


