|
EUR/GBP Technical Analysis: 50-day SMA, descending channel push bears toward 0.8500

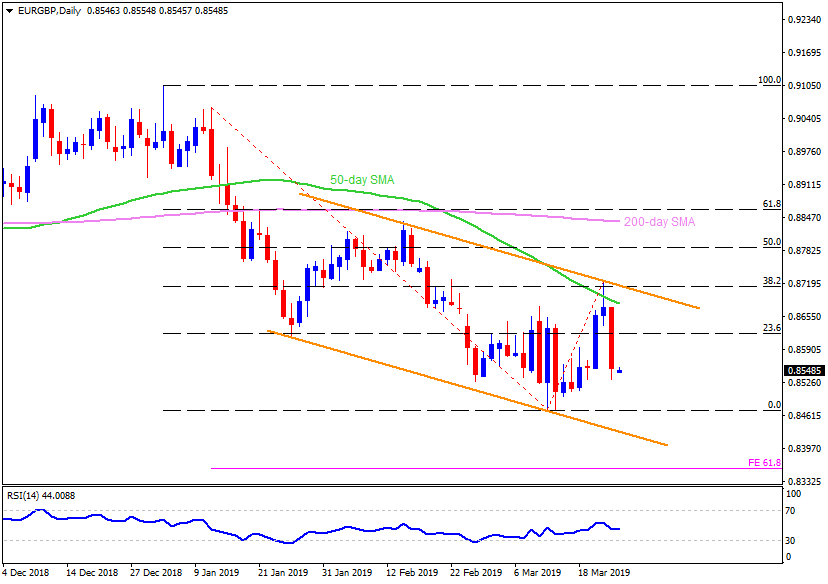
EUR/GBP daily chart
- EUR/GBP is little changed near 0.8550 at the start of Asian trading on Monday.
- Following its failure to successfully cross 50-day simple moving average (SMA), the pair is likely declining towards mid-month low around 0.8500.
- Though, the current month low surrounding 0.8470 and support-line of two-month-old descending trend-channel, at 0.8430 now, can entertain sellers afterward.
- During additional selling pressure beneath 0.8430, 61.8% Fibonacci expansion (FE) of January 11 to March 21 moves, at 0.8360, could become bear’s favorite.
- Meanwhile, 0.8640 and 50-day simple moving average (SMA) level of 0.8680 may restrict the quote’s near-term upside ahead of diverting market attention to 0.8715/20 resistance-confluence comprising 38.2% Fibonacci retracement of January – March downturn and upper-line of the said channel.
- If at all buyers manage to conquer 0.8720, 50% Fibonacci at 0.8790 and 200-day SMA level of 0.8840 could flash on their list.
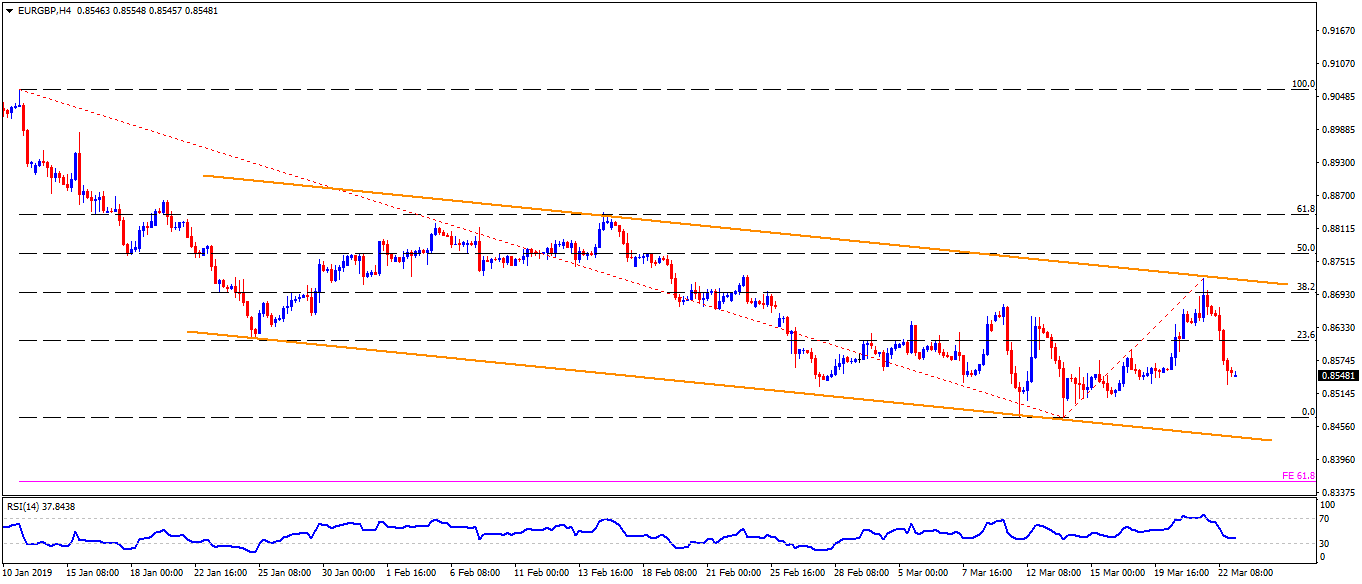
EUR/GBP 4-Hour chart
- 0.8670 is likely an intermediate halt between 0.8640 and 0.8680.
- On the downside, 0.8530 seem adjacent support to watch.
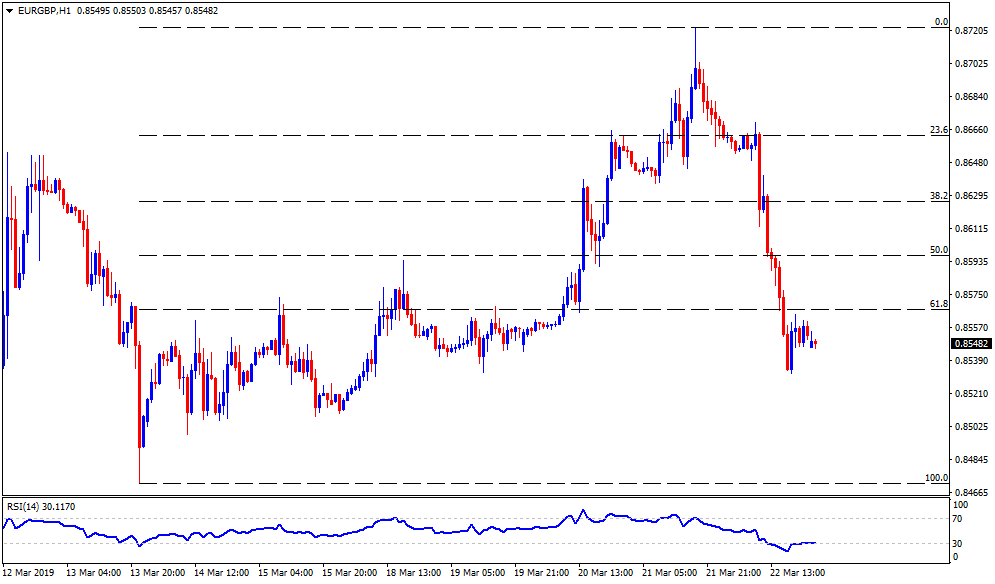
EUR/GBP hourly chart
- Latest top at 0.8570 could become the closest resistance with 0.8510 being expected additional support.
Author

Anil Panchal
FXStreet
Anil Panchal has nearly 15 years of experience in tracking financial markets. With a keen interest in macroeconomics, Anil aptly tracks global news/updates and stays well-informed about the global financial moves and their implications.
More from Anil Panchal


