EUR/GBP slides below 0.8670 following weak Eurozone Retail Sales
- The Euro extends losses after downbeat Eurozone Retail Sales data
- Retail Consumption in the Euro area has dropped 0.5% in July, well beyond market expectations of a 0.2% decline.
- Technical indicators show bears taking control with their focus on trendline resistance at 0.8630.

The Euro extended its reversal from 0.8715 highs against the British Pound on Thursday. The pair broke the intraday low at 0.8670 following weak Eurozone retail sales figures, reaching fresh lows at 0.8660 so far.
Eurostat data released earlier on Thursday has shown that retail consumption fell 0.5% in July, exceeding expectations of a 0.2% drop, from an upwardly revised 0.6% increase in June. Year-on-year, retail sales increased 2.2%, below the 2.4% expected, and also below the 3.5% growth seen in the previous month
Technical Analysis: Price action remains moving within an expanding wedge
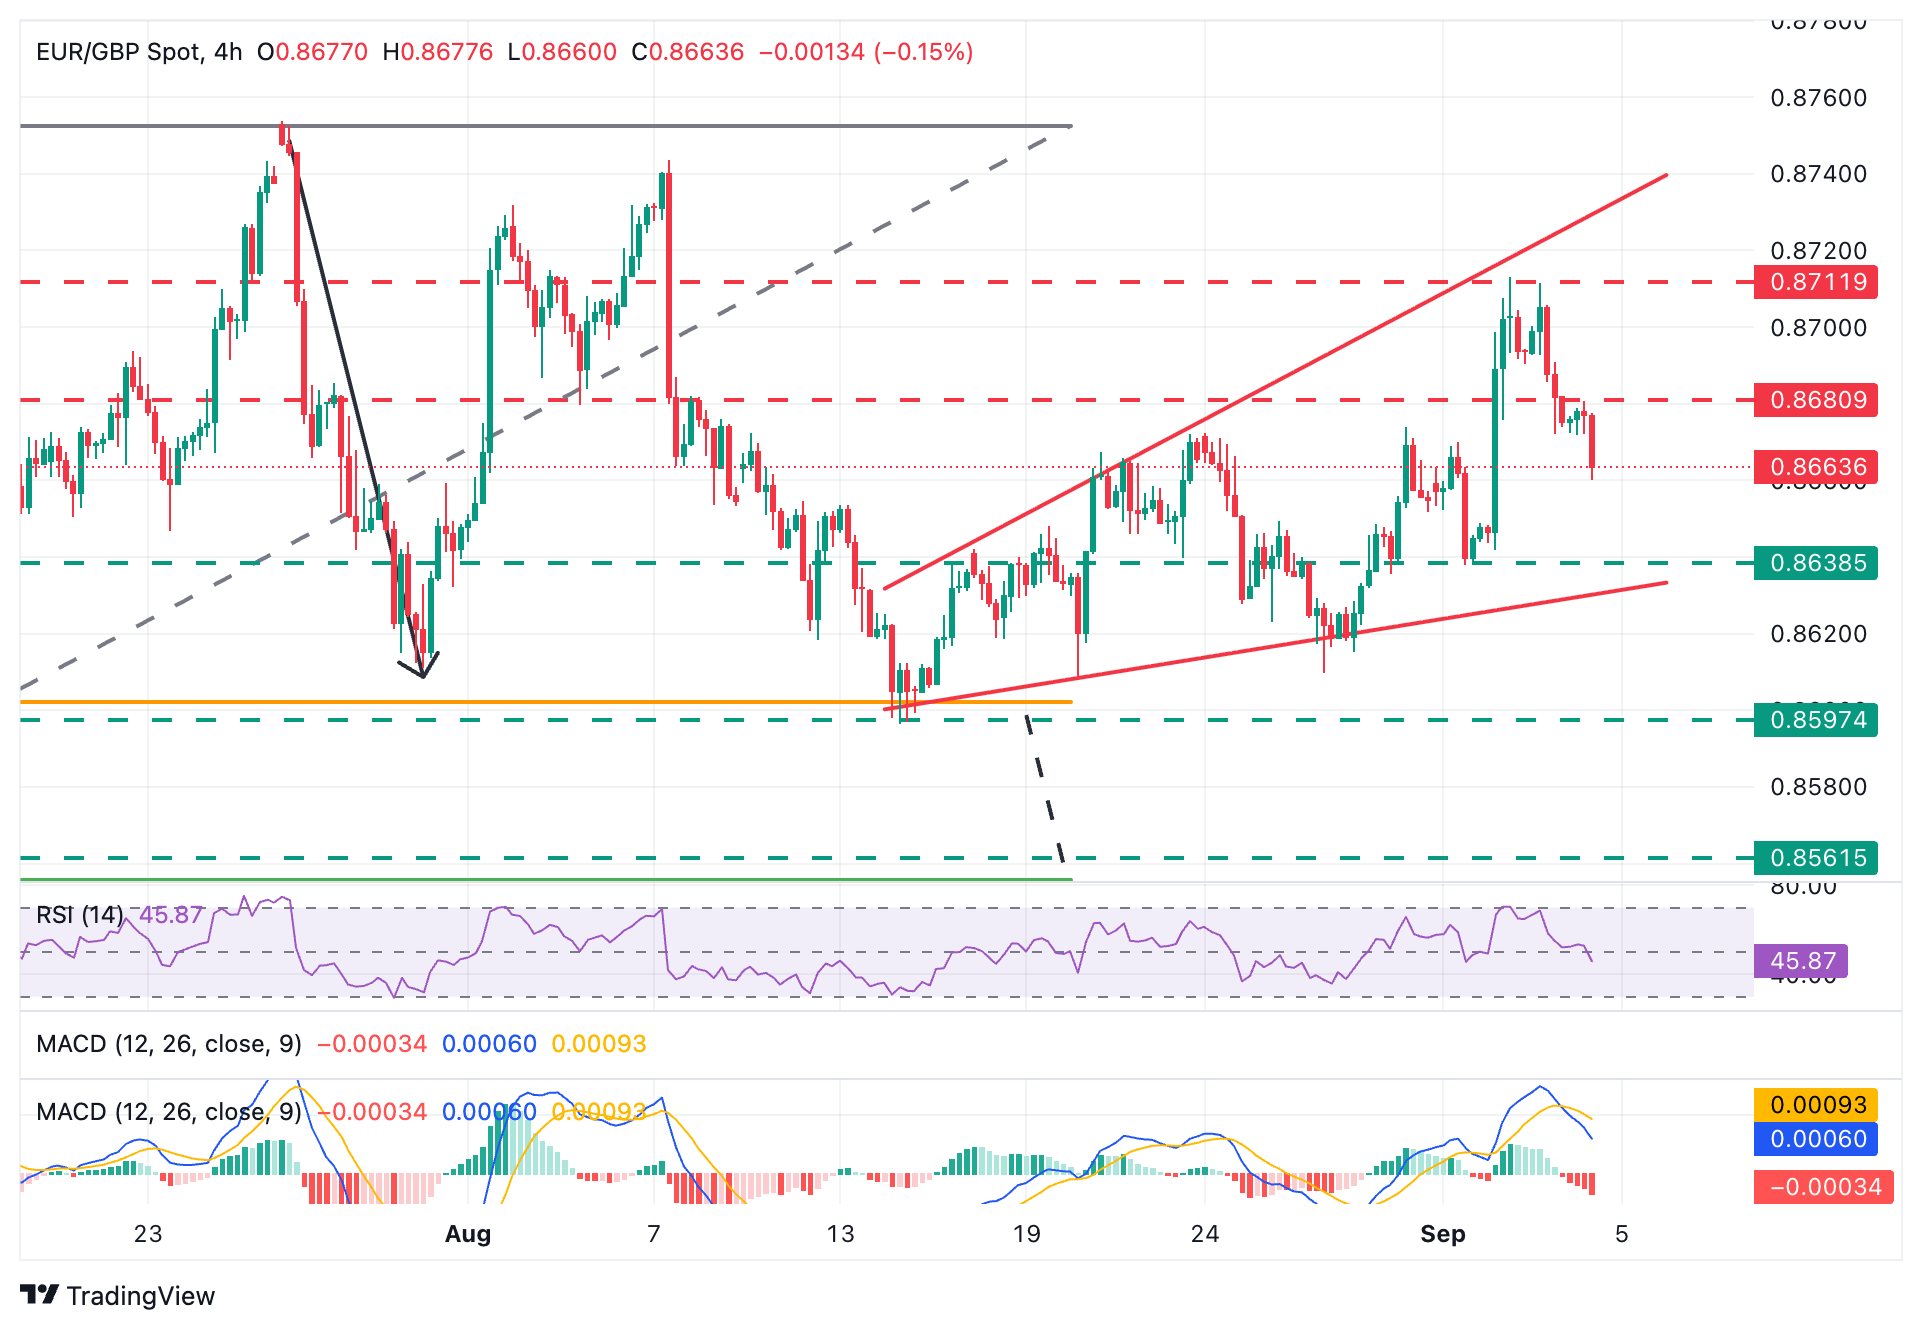
A look at the 4-hour chart reveals a mounting bearish momentum, with the pair trading within a broadening wedge pattern, a figure often seen near major tops.
The RSI has dropped below the 50 line, and the MACD has crossed below the signal line, suggesting that bears are taking control. Sellers have pushed the pair below Wednesday’s low, at 0.8670, aiming for the wedge bottom, now around 0.8630. Further down the 0.8600 (July 7, August 14 lows) is a key support area.
To the upside, immediate resistance is at the intraday highs of 0.8680, ahead of the September 2 and 3 highs, at the 0.8710-0.8715 area and the wedge top, now at 0.8730.
Euro Price Today
The table below shows the percentage change of Euro (EUR) against listed major currencies today. Euro was the strongest against the Australian Dollar.
| USD | EUR | GBP | JPY | CAD | AUD | NZD | CHF | |
|---|---|---|---|---|---|---|---|---|
| USD | 0.16% | 0.02% | 0.16% | 0.20% | 0.33% | 0.18% | 0.15% | |
| EUR | -0.16% | -0.13% | -0.02% | 0.04% | 0.24% | 0.02% | -0.05% | |
| GBP | -0.02% | 0.13% | 0.20% | 0.17% | 0.36% | 0.17% | 0.08% | |
| JPY | -0.16% | 0.02% | -0.20% | 0.04% | 0.11% | 0.07% | 0.01% | |
| CAD | -0.20% | -0.04% | -0.17% | -0.04% | 0.11% | 0.00% | -0.09% | |
| AUD | -0.33% | -0.24% | -0.36% | -0.11% | -0.11% | -0.21% | -0.27% | |
| NZD | -0.18% | -0.02% | -0.17% | -0.07% | -0.00% | 0.21% | -0.03% | |
| CHF | -0.15% | 0.05% | -0.08% | -0.01% | 0.09% | 0.27% | 0.03% |
The heat map shows percentage changes of major currencies against each other. The base currency is picked from the left column, while the quote currency is picked from the top row. For example, if you pick the Euro from the left column and move along the horizontal line to the US Dollar, the percentage change displayed in the box will represent EUR (base)/USD (quote).
Economic Indicator
Retail Sales (MoM)
The Retail Sales data, released by Eurostat on a monthly basis, measures the volume of retail sales in the Eurozone. It shows the performance of the retail sector in the short term, which accounts for around 5% of the total value added of the Eurozone economies. Retail Sales data is widely followed as an indicator of consumer spending. Percent changes reflect the rate of changes in such sales, with the MoM reading comparing sales volumes in the reference month with the prior month. Generally, a high reading is seen as bullish for the Euro (EUR), while a low reading is seen as bearish
Read more.Last release: Thu Sep 04, 2025 09:00
Frequency: Monthly
Actual: -0.5%
Consensus: -0.2%
Previous: 0.3%
Source: Eurostat
Author

Guillermo Alcala
FXStreet
Graduated in Communication Sciences at the Universidad del Pais Vasco and Universiteit van Amsterdam, Guillermo has been working as financial news editor and copywriter in diverse Forex-related firms, like FXStreet and Kantox.


