|

EUR/GBP Price Forecast: A correction or a reversal of the trend?

  • EUR/GBP recovers from multi-year lows but then pulls back down. 
  • Is the pair about to reverse trend higher or is it still overall bearish?

EUR/GBP gaps higher at the open on Monday and starts climbing again. The pair had been pulling back since the completion of a three-wave, zig-zag-shaped pattern last Thursday. This pattern has been drawn on the chart below with the waves labeled a,b and c. 

EUR/GBP 4-hour Chart 

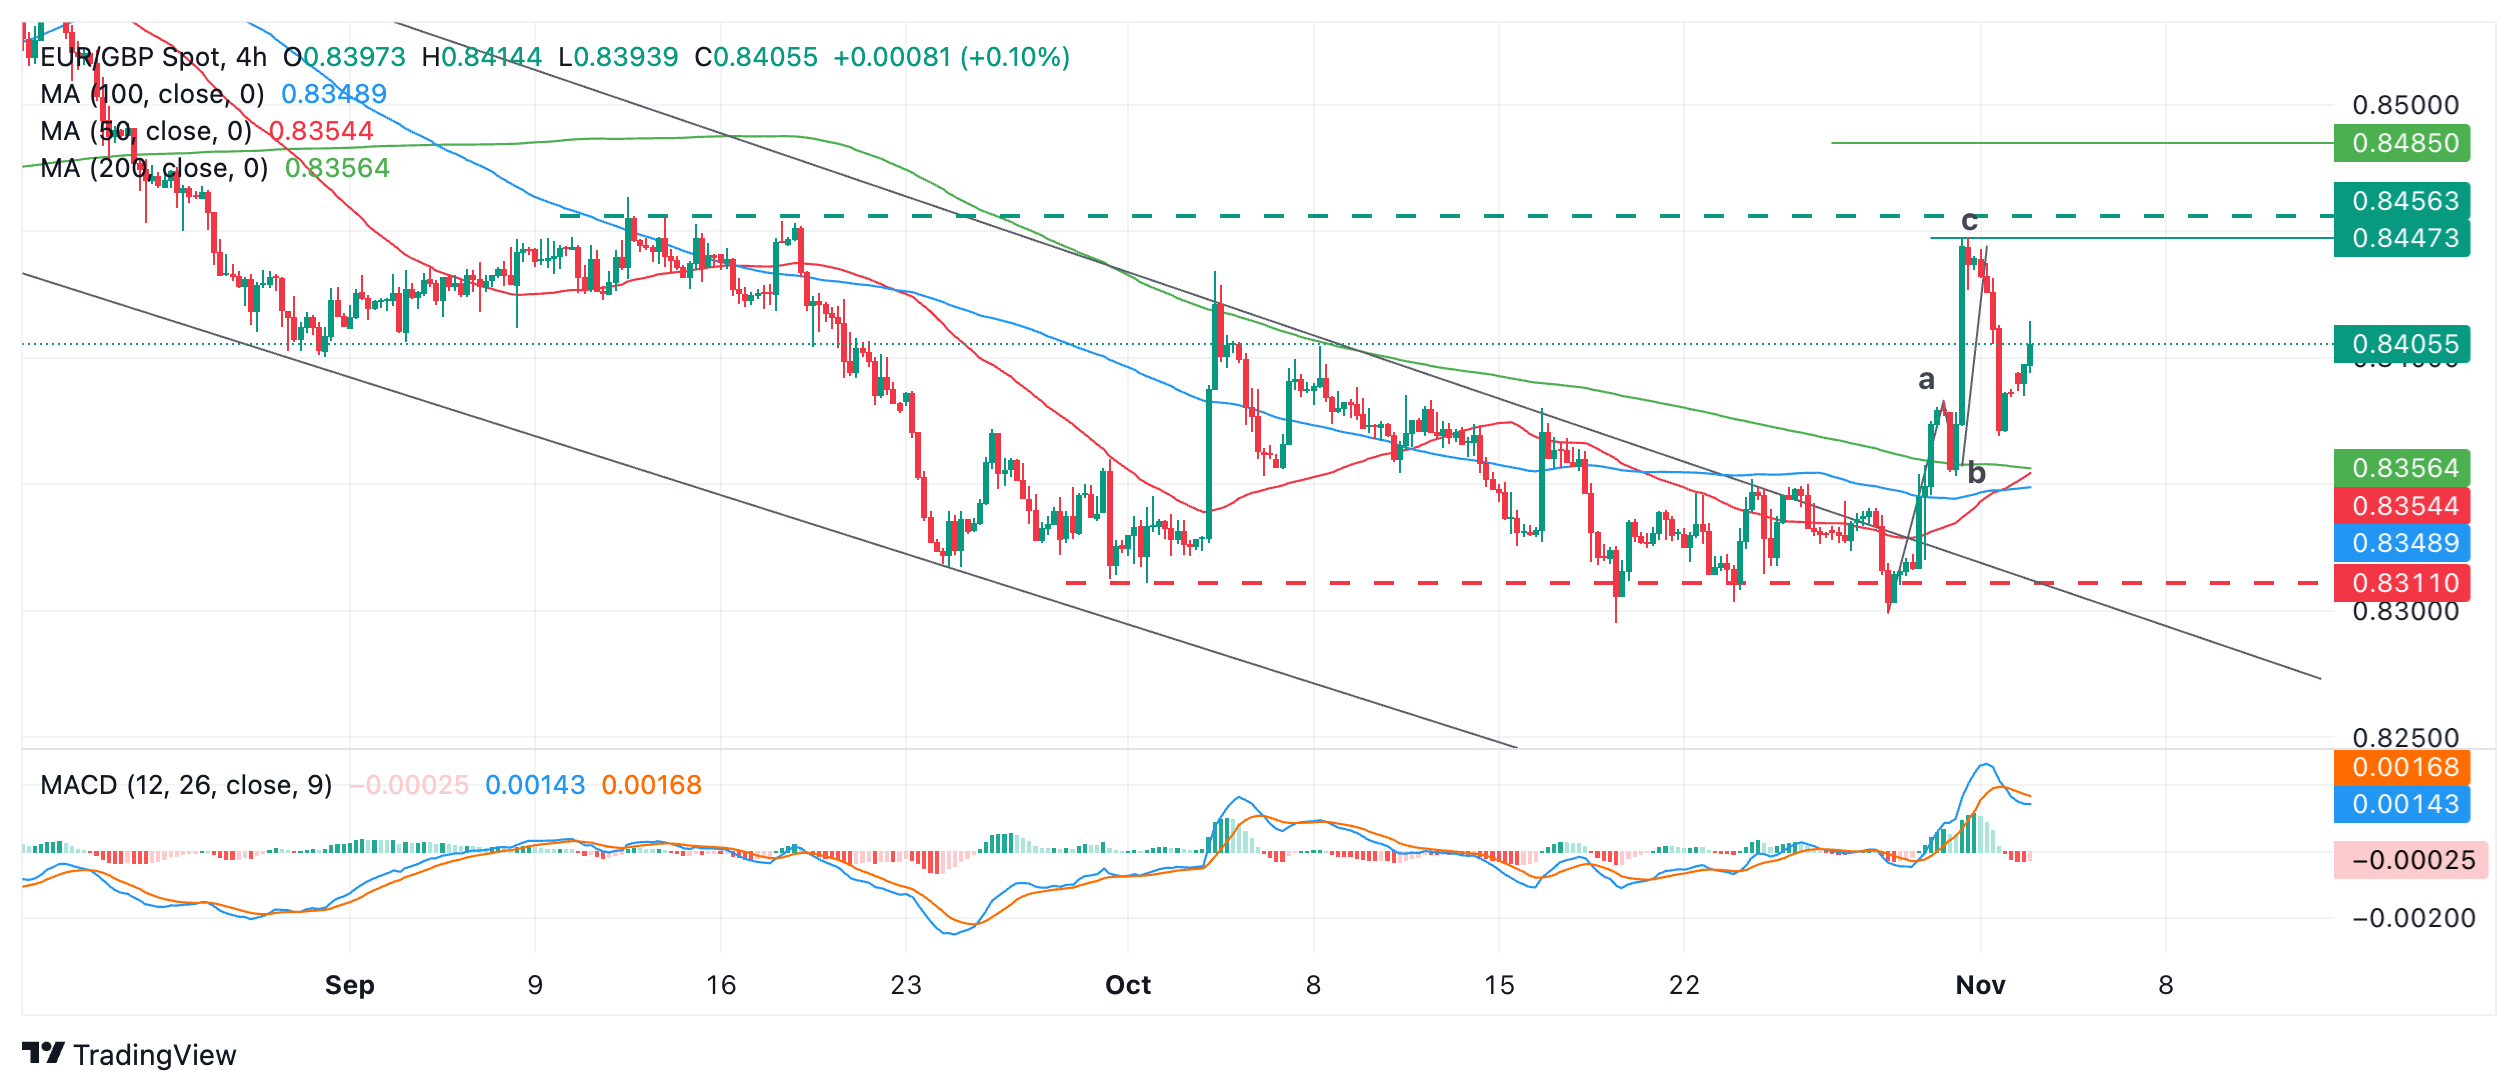
In the very near-term the pair might fall to fill the open gap left after price jumped higher on Monday. Technical analysis theory argues that gaps have a greater tendency of being closed. 

The abc pattern could be either a correction of the overall downtrend or the start of a new short-term uptrend. 

If it is just a correction, the price will probably continue falling in line with the medium and longer-term downtrend, with a target at the 0.8311 multi-year lows. 

If price manages to break above the high of wave c, however, it will have formed a third higher high, thereby establishing a new sequence of rising peaks and troughs. This is a strong indicator of a new uptrend. Give the technical analysis principle that “the trend is your friend” the odds would then favor further upside to come. 

The steepness of the abc pattern strengthens the case of this being a reversal rather than a correction. 

A failure to pierce above the top of wave c would indicate the pair is probably not reversing.  

It would suggest EUR/GBP will probably remain trapped oscillating within the red and green dashed lines on the chart at 0.8311 and 0.8456 respectively. 

Author

Joaquin Monfort

Joaquin Monfort is a financial writer and analyst with over 10 years experience writing about financial markets and alt data. He holds a degree in Anthropology from London University and a Diploma in Technical analysis.

More from Joaquin Monfort
Share:

Editor's Picks

AUD/USD eyes 0.7150 barrier nine-day EMA

AUD/USD inches higher after registering modest losses in the previous day, trading around 0.7130 during the Asian hours. The technical analysis of the daily chart indicates that the pair is moving sideways within the rectangle pattern, suggesting a consolidation as neither the bulls nor the bears have enough momentum to take control of the market.

USD/JPY trades below 160.00 intervention threshold; bullish bias intact

The USD/JPY pair attracts some sellers during the Asian session amid fears that authorities will step in again to prop up the Japanese Yen. Furthermore, the Israel-Lebanon truce prompts some profit-taking around the US Dollar and exerts downward pressure on the currency pair.

Gold meets contention near $4,420…for now

Gold extends its recovery past the $4,500 mark per troy ounce on Thursday. The yellow metal’s advance comes amid the resurgence of some selling interest around the, improving risk sentiment, and declining US Treasury yields across the curve.

Bitcoin’s massive storm is back: Why the sell-off is far from over

Bitcoin price action over the last few weeks has felt less like a normal, healthy correction and more like a slow grinding crash that continues to wreak havoc on holdings and trading accounts. And everything suggests that the dramatic crash isn’t over.

Nonfarm payrolls: Testing the limits of Fed policy patience

The upcoming nonfarm payrolls report for May will provide the final update on the US labor market before Kevin Warsh attends his first policy meeting as the new Fed Chair later this month.

Recession on paper: What really moves the Canadian Loonie now?

Statistics Canada handed the headline writers a gift and the analysts a headache. Real GDP shrank 0.1% on an annualized basis in the first quarter, and with the fourth quarter of 2025 revised down to a 1.0% contraction, that is two negative quarters in a row, the textbook definition of a technical recession and Canada's first since the pandemic.