|

EUR/GBP Price Analysis: Slid on high UK yields, dark cloud cover formation

  • EUR/GBP slides as UK bond yields surpass German bond yields, strengthening the Pound.
  • From a technical perspective, the pair exhibits a neutral to downward bias, with long-term daily EMAs standing above exchange rates.
  • The EUR/GBP must regain the 0.8600 level and surpass the May 24 daily low resistance of 0.8648 to shift its bias.
  • The pair’s immediate support is at 0.8500, a breach below, which could lead to a decline toward 0.8535.

EUR/GBP slid during the Friday session as UK bond yields surpassed German bond yields, the strongest of the Eurozone (EU), bolstering the appetite for the Pound Sterling  (GBP). That, alongside a dark-cloud conver technical chart pattern, exacerbated the EUR/GBP’s fall below the 0.8600 figure. At the time of writing, the EUR/GBP is trading at 0.8585, down 0.33%.

EUR/GBP Price Analysis: Technical outlook

From a technical perspective, the EUR/GBP is still neutral to downward biased, with long-term daily Exponential Moving Averages (EMAs) standing above the exchange rates; while the EUR/GBP remains unable to break the May 24 daily low support area turned resistance at around 0.8648, and seen as the latest swing low needed to be broken, to change the pair’s bias.

However, on its way toward that level, the EUR/GBP must reclaim the 0.8600 figure. A breach of the latter will expose the 0.8648 May low, which, If broken decisively, it could pave the way toward the confluence of the 100 and 200-day Exponential Moving Averages (EMAs) at 0.8693/95 before challenging 0.8700.  

Conversely, and the path of least resistance, the EUR/GBP first support would be the 0.8500 mark. A dip below will send the cross toward the June 23 daily low of 0.8535 before testing the June 19 swing low of 0.8518 before slumping to the 0.85 figure.

EUR/GBP Price Action – Daily chart
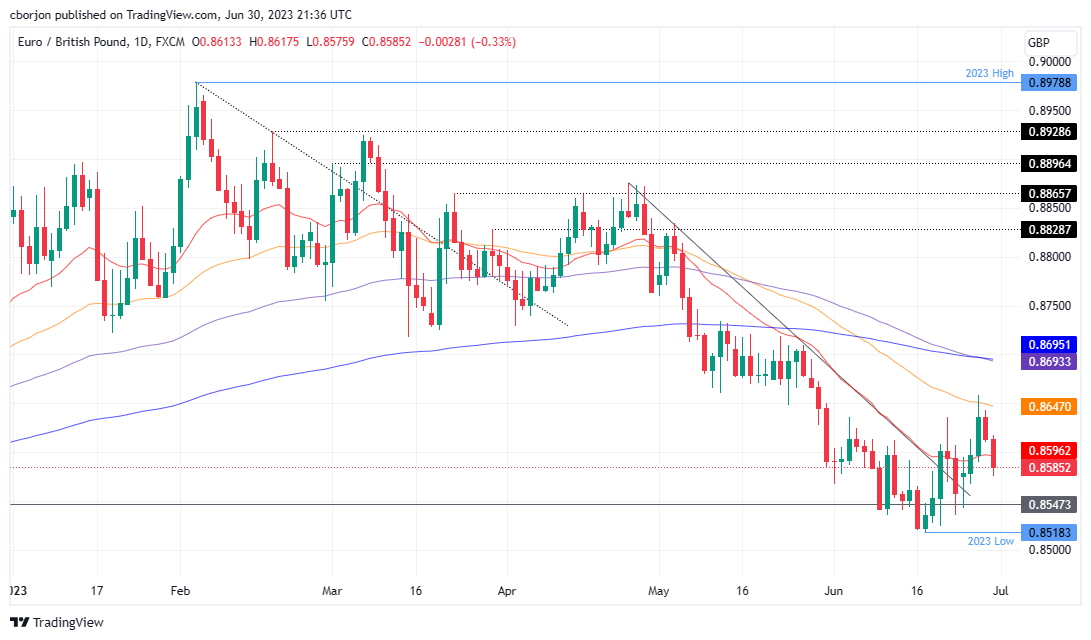
EUR/GBP Daily chart

EUR/GBP

Overview
Today last price0.8592
Today Daily Change-0.0021
Today Daily Change %-0.24
Today daily open0.8613
 
Trends
Daily SMA200.8582
Daily SMA500.8668
Daily SMA1000.8744
Daily SMA2000.8747
 
Levels
Previous Daily High0.8643
Previous Daily Low0.8611
Previous Weekly High0.8636
Previous Weekly Low0.8518
Previous Monthly High0.8835
Previous Monthly Low0.8583
Daily Fibonacci 38.2%0.8623
Daily Fibonacci 61.8%0.8631
Daily Pivot Point S10.8601
Daily Pivot Point S20.859
Daily Pivot Point S30.8569
Daily Pivot Point R10.8634
Daily Pivot Point R20.8655
Daily Pivot Point R30.8667

Author

Christian Borjon Valencia

Markets analyst, news editor, and trading instructor with over 14 years of experience across FX, commodities, US equity indices, and global macro markets.


More from Christian Borjon Valencia
Share:

Editor's Picks

GBP/USD holds lower ground near 1.3450 on USD rebound

GBP/USD trades in negative territory around 1.3450 in the European trading hours on Friday. Heightened Middle East tensions and rising global oil prices provide some support for the safe-haven US Dollar (USD), weighing on the pair. The US Michigan Consumer Sentiment Index will be published later on Friday. 


EUR/USD holds above 1.150 after EU inflation data

EUR/USD holds steady above 1.1500 on Friday following a two-day rally that saw the pair gain more than 1%. While the risk-averse market atmosphere supports the US Dollar and caps the pair's upside, the stronger-than-expected HICP inflation figures from the Eurozone helps it keep its footing.

Gold sticks to losses as Iran risks revive USD demand

Gold meets with a fresh supply on Friday as the US Dollar rebounds from a one-and-a-half-month trough. Escalating US-Iran tensions keep inflation risks and Fed rate hike bets in play, supporting the USD. The technical setup seems tilted in favor of bearish traders and backs the case for further losses.


Bitcoin eyes 50-day EMA breakout, Ethereum consolidates, XRP steadies

Bitcoin, Ethereum, and Ripple trade near key technical levels on Friday as the broader cryptocurrency market pauses following last week's recovery. BTC is approaching the 50-day Exponential Moving Average while ETH continues to consolidate between two major EMAs.

Indian Rupee hits fresh two-week high against US Dollar

The Indian Rupee extends the week-long rally against the US Dollar on Friday. The USD/INR pair slides to a fresh over two-week low near 95.30 due to the overnight slump in the US Dollar amid growing doubts regarding whether the Federal Reserve is seriously committed to bringing the United States inflation down.

9-3: Is the Federal Reserve’s vote tally Warsh's new forward guidance?
The rate did not move. Neither did the statement, and that’s the more interesting fact. Set the July 29 Federal Open Market Committee (FOMC) statement beside the one issued on June 17, and the two documents are identical apart from a single verb and a paragraph at the bottom naming three dissenters.












