EUR/GBP Price Analysis: Sellers in charge, eyeing a break of the 200-day EMA around 0.8340s


  • The EUR/GBP cross-currency tumbled since Tuesday close to 200 pips.
  • Fragile market mood shows investors’ nervousness in an uncertain scenario.
  • EUR/GBP Price Analysis: Pressured around the 200-day EMA; once cleared, a fall towards 0.8300 is on the cards.

On Friday, the EUR/GBP trims some of Thursday’s losses, though braced for the confluence of the 100 and 200-day EMAs around 0.8440-44 during the North American session. At 0.8455, the EUR/GBP is up by a minimal 0.10%.

US equities wobble, reflecting a downbeat market mood. The EU’s energy crisis linked to Russia’s invasion of Ukraine, and signs of EU economic contagion or even contraction, weigh heavily in the shared currency, particularly in the EUR/GBP pair. Meanwhile, BoE’s Pill and Mann expressed the need for faster rate hikes in the UK amidst the resignation of UK’s Prime Minister Boris Johnson.

In the meantime, the cross-currency opened near 0.8445 and slid towards the daily low below 0.8440 before printing the daily high at 0.8475.
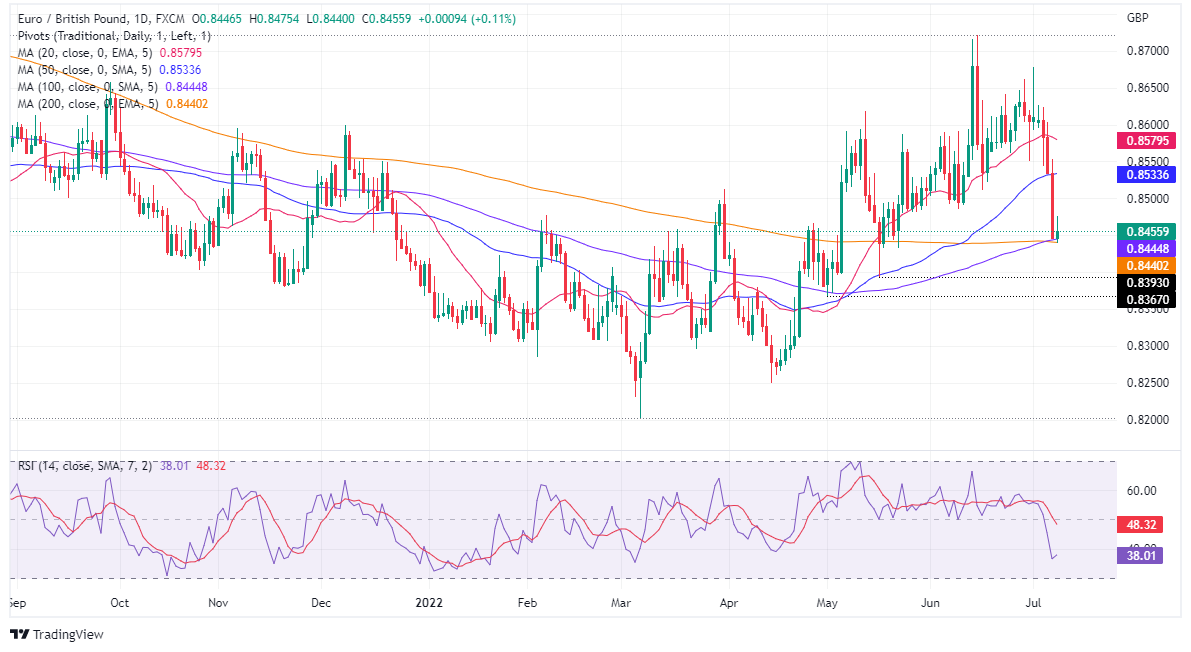
EUR/GBP Daily chart

The EUR/GBP is about to change its bias, due in part to fundamental reasons attached to a Euro area economic slowdown, but also for the presence of the 200-day EMA just 12 pips below the current exchange rate. The EUR/GBP fall from 0.8600 to current price levels shifted the Relative Strength Index (RSI) to bearish conditions, meaning that selling pressure lies ahead.

Therefore, the EUR/GBP bias in the near term is neutral but slightly tilted to the downside. Break below the 200-day EMA will expose the 0.8400 figure. Once cleared, EUR sellers’ next stop will be the May 2 swing low at 0.8367, followed by the 0.8300 figure.

EUR/GBP Key Technical Level

EUR/GBP

Overview
Today last price 0.8455
Today Daily Change 0.0009
Today Daily Change % 0.11
Today daily open 0.8448
 
Trends
Daily SMA20 0.8587
Daily SMA50 0.8537
Daily SMA100 0.8448
Daily SMA200 0.8445
 
Levels
Previous Daily High 0.8554
Previous Daily Low 0.8445
Previous Weekly High 0.8679
Previous Weekly Low 0.8551
Previous Monthly High 0.8721
Previous Monthly Low 0.8486
Daily Fibonacci 38.2% 0.8487
Daily Fibonacci 61.8% 0.8513
Daily Pivot Point S1 0.8411
Daily Pivot Point S2 0.8374
Daily Pivot Point S3 0.8302
Daily Pivot Point R1 0.852
Daily Pivot Point R2 0.8591
Daily Pivot Point R3 0.8629


Share: Feed news

Information on these pages contains forward-looking statements that involve risks and uncertainties. Markets and instruments profiled on this page are for informational purposes only and should not in any way come across as a recommendation to buy or sell in these assets. You should do your own thorough research before making any investment decisions. FXStreet does not in any way guarantee that this information is free from mistakes, errors, or material misstatements. It also does not guarantee that this information is of a timely nature. Investing in Open Markets involves a great deal of risk, including the loss of all or a portion of your investment, as well as emotional distress. All risks, losses and costs associated with investing, including total loss of principal, are your responsibility. The views and opinions expressed in this article are those of the authors and do not necessarily reflect the official policy or position of FXStreet nor its advertisers. The author will not be held responsible for information that is found at the end of links posted on this page.

If not otherwise explicitly mentioned in the body of the article, at the time of writing, the author has no position in any stock mentioned in this article and no business relationship with any company mentioned. The author has not received compensation for writing this article, other than from FXStreet.

FXStreet and the author do not provide personalized recommendations. The author makes no representations as to the accuracy, completeness, or suitability of this information. FXStreet and the author will not be liable for any errors, omissions or any losses, injuries or damages arising from this information and its display or use. Errors and omissions excepted.

The author and FXStreet are not registered investment advisors and nothing in this article is intended to be investment advice.

Recommended content


Recommended content

Editors’ Picks

EUR/USD clings to daily gains above 1.0650

EUR/USD clings to daily gains above 1.0650

EUR/USD gained traction and turned positive on the day above 1.0650. The improvement seen in risk mood following the earlier flight to safety weighs on the US Dollar ahead of the weekend and helps the pair push higher.

EUR/USD News

GBP/USD recovers toward 1.2450 after UK Retail Sales data

GBP/USD recovers toward 1.2450 after UK Retail Sales data

GBP/USD reversed its direction and advanced to the 1.2450 area after touching a fresh multi-month low below 1.2400 in the Asian session. The positive shift seen in risk mood on easing fears over a deepening Iran-Israel conflict supports the pair.

GBP/USD News

Gold holds steady at around $2,380 following earlier spike

Gold holds steady at around $2,380 following earlier spike

Gold stabilized near $2,380 after spiking above $2,400 with the immediate reaction to reports of Israel striking Iran. Meanwhile, the pullback seen in the US Treasury bond yields helps XAU/USD hold its ground.

Gold News

Bitcoin Weekly Forecast: BTC post-halving rally could be partially priced in Premium

Bitcoin Weekly Forecast: BTC post-halving rally could be partially priced in

Bitcoin price shows no signs of directional bias while it holds above  $60,000. The fourth BTC halving is partially priced in, according to Deutsche Bank’s research. 

Read more

Week ahead – US GDP and BoJ decision on top of next week’s agenda

Week ahead – US GDP and BoJ decision on top of next week’s agenda

US GDP, core PCE and PMIs the next tests for the Dollar. Investors await BoJ for guidance about next rate hike. EU and UK PMIs, as well as Australian CPIs also on tap.

Read more

Forex MAJORS

Cryptocurrencies

Signatures