EUR/GBP Price Analysis: Climbing higher within its range
- EUR/GBP price is rising within its range after bouncing off support at the range floor.
- The trend is sideways and likely to extend, with price oscillating within the range.
- EUR/GBP has just been pushed back by resistance from a cluster of Moving Averages in the 0.8560s.

EUR/GBP price is rising up within a multi-month range after bouncing off support at the lows.
The pair is in a sideways trend and given the old traders adage that “the trend is your friend,” is tipped to continue unfolding within the range.
EUR/GBP 4-hour Chart
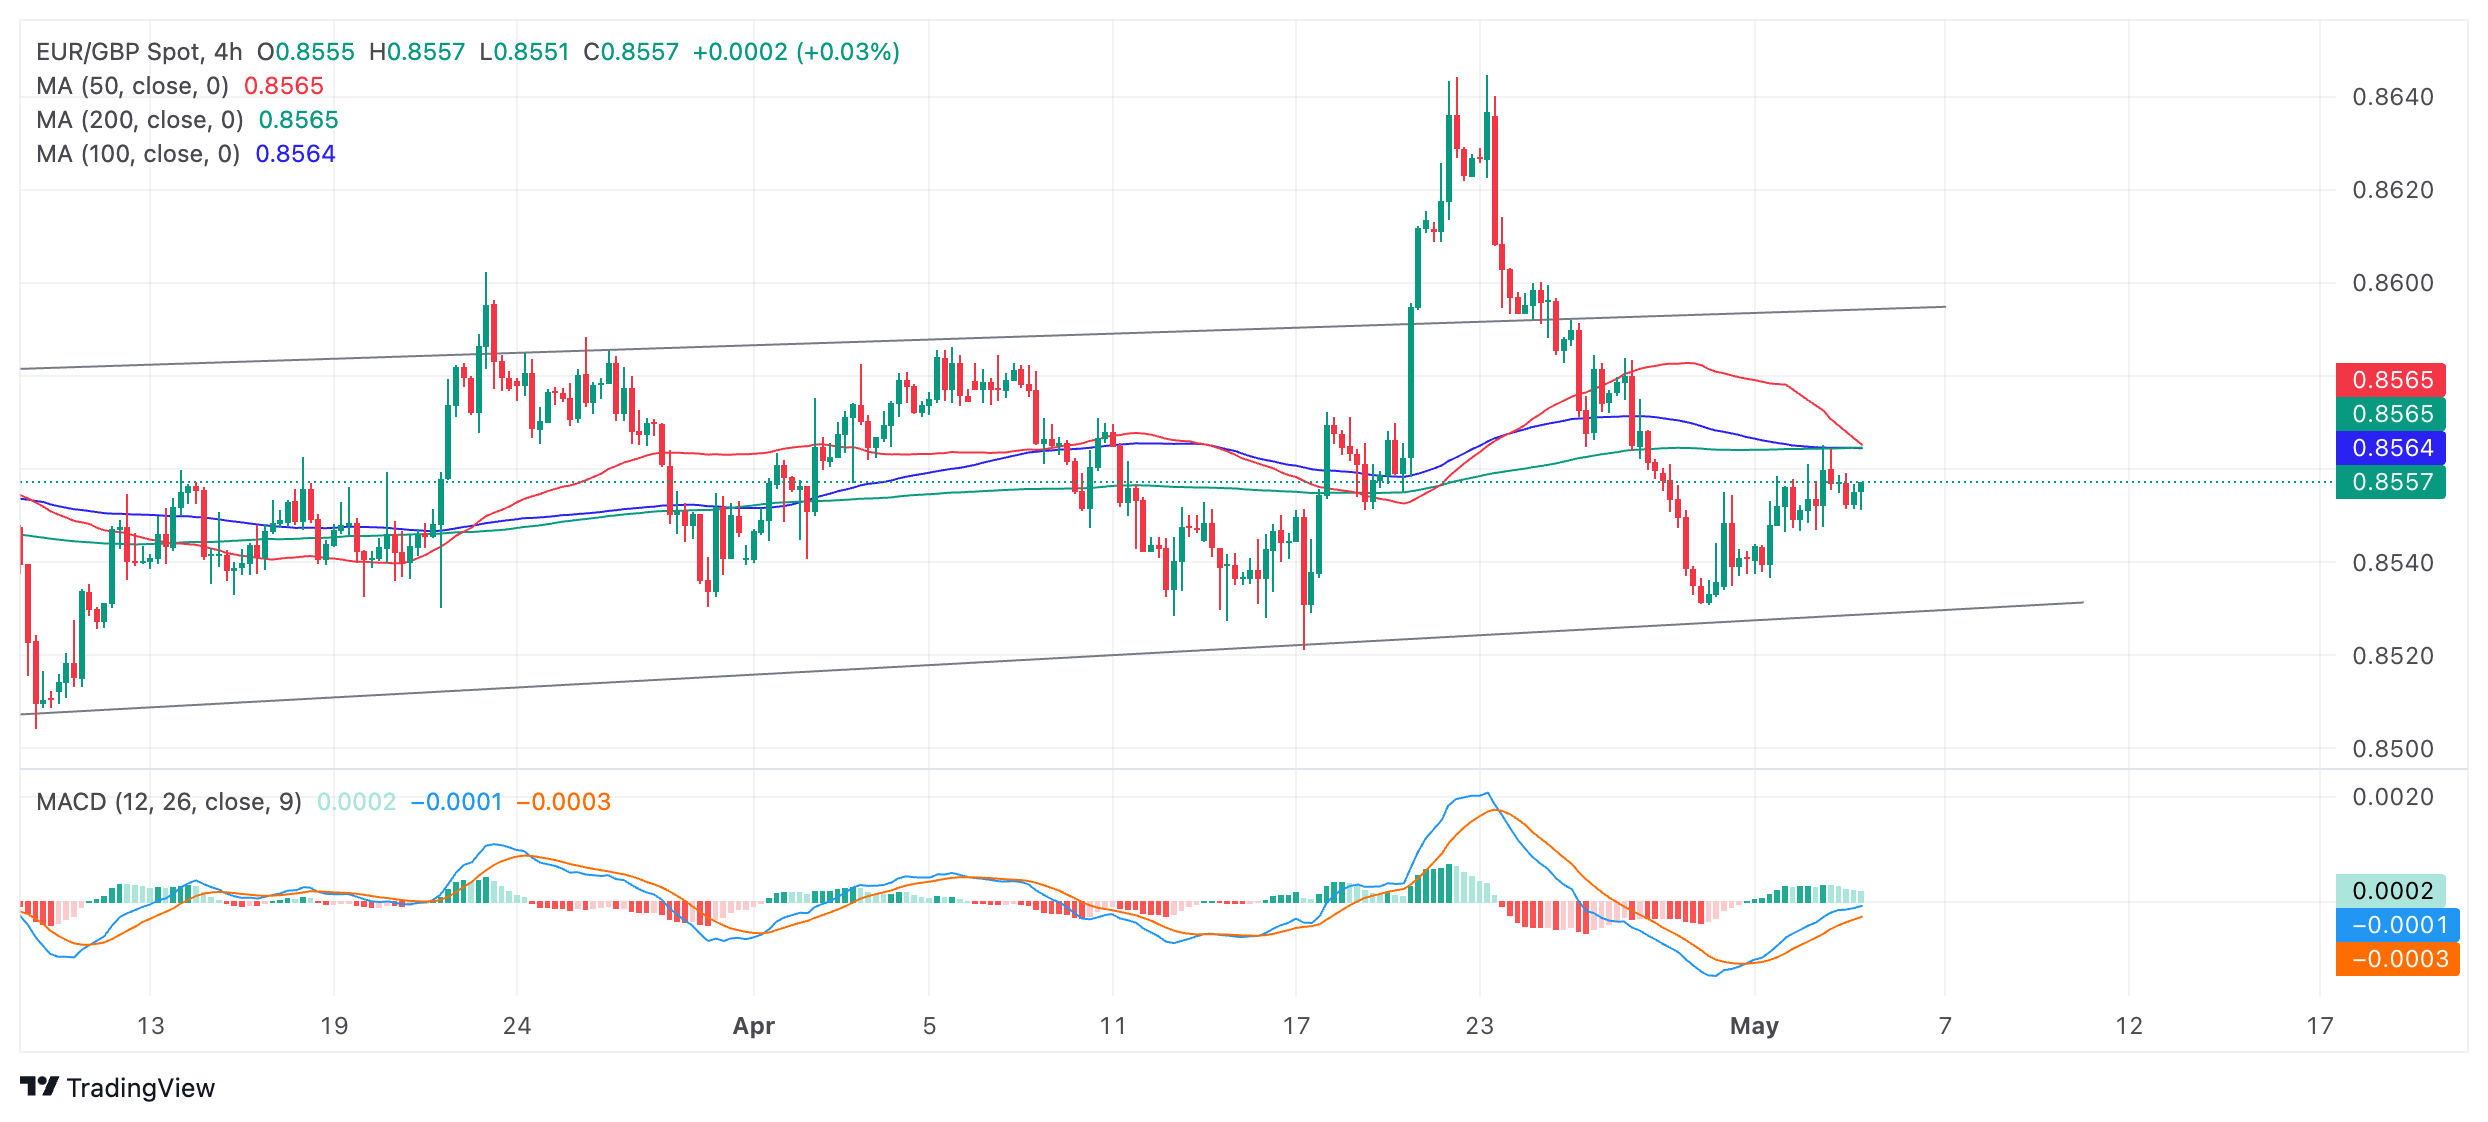
EUR/GBP has just pulled back after touching resistance from the cluster of Moving Averages in the 0.8560s. It would have to break decisively above the MAs at 0.8565 to confirm more upside, to a target at the ceiling of the range at roughly 0.8595.
The Moving Average Convergence Divergence (MACD) indicator recently crossed above its signal line giving a buy signal. This confirmed the rotation from off the range lows back up within the range. The signal was enhanced by the fact the pair was in a sideways trend and MACD is proven to be a more reliable indicator in non-trending markets.
EUR/GBP is expected to remain range-bound until a strong directional move breaks the trend.
A decisive break below the range low would open the way for more downside to the next target at 0.8486. This is the 0.681 Fibonacci ratio of the height of the range extrapolated lower from the channel’s base. This is the method used by technical analysts to estimate range breakouts. Further weakness could even see price reach the next target at 0.8460, the full height of the range extrapolated lower (1.000).
Likewise a decisive break above the range high at 0.8595 would signal a breakout with an initial target at 0.8635 followed by the 0.8645 highs.
A decisive break would be one characterized by a long candlestick that broke completely above or below the range floor and closed near its high or low, or three consecutive red candlesticks that broke clearly through the level.
Author

Joaquin Monfort
FXStreet
Joaquin Monfort is a financial writer and analyst with over 10 years experience writing about financial markets and alt data. He holds a degree in Anthropology from London University and a Diploma in Technical analysis.


