|

Emini S&P and Nasdaq analysis: Are major banks predicting a sell signal in the market?

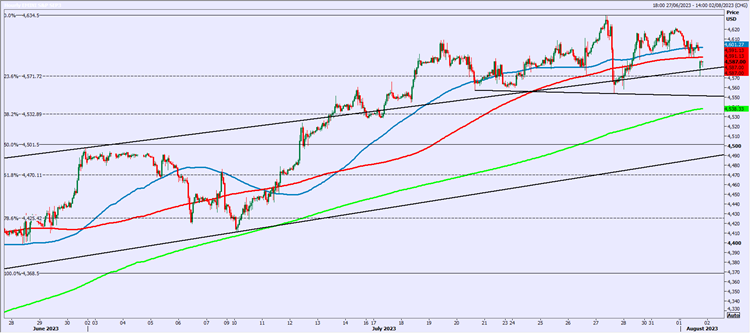
Emini S&P September could be forming a short term head & shoulders or a diamond top after we failed to retest last week's high at 4634.

We are trading below the 100 & 200 hour moving averages which is a warning to short term bulls. We are testing support at 4570/60 but I am less confident this will hold today & a break below 4550 should be a sell signal to target 4535 & 4510/4500.

Resistance at 4600/4610. A break higher can retest 4630/35. A break above 4640 is a buy signal & can target 4670/75, perhaps as far as 4695/99.

Chart

Nasdaq September has traded sideways for 2 weeks in a range from 15522/483 up to 16062.

Short term support at 15700/650. A break below here is a sell signal for today & can target 15470/420.

A break below 15400 is the next sell signal for this week targeting 15300/250.

Minor 2 week trend line resistance at 15800/850. A break above 15900 can retest the July recovery high at 16040/16060. A break above here can target 16300/350.

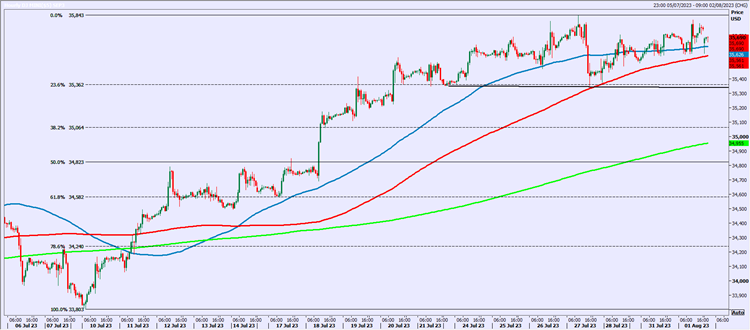
Emini Dow Jones September staged a recovery after Thursday's negative action & we retested Friday's high but held which means we have a potential double top pattern forming. The question now is whether we break above Thursday's high at 35843 to continue the bull trend or Thursday's low & support at 35375/345. (I favour a break lower but I am only guessing).

A break lower confirms the double top for a sell signal targeting 35100/35000, probably as far as 34850.

Chart

Author

Jason Sen

Jason Sen

DayTradeIdeas.co.uk

More from Jason Sen
Share:

Markets move fast. We move first.

Orange Juice Newsletter brings you expert driven insights - not headlines. Every day on your inbox.

By subscribing you agree to our Terms and conditions.

Editor's Picks

EUR/USD eyes 1.1800 barrier near two-month highs

EUR/USD extends its gains for the second consecutive day on Tuesday and approaches 1.1800. On the daily chart, technical analysis indicates a persistent bullish bias, as the pair moves upward within the ascending channel pattern. Additionally, the 14-day Relative Strength Index at 68.89 reaffirms the bullish bias.

GBP/USD climbs to 1.3500 area, renews ten-week high

GBP/USD extends its weekly rally and trades at its highest level since early October near 1.3500. The US Dollar remains under persistent bearish pressure heading into the holidays, while Pound traders largely brush off the latest interest rate cut from the Bank of England.

Gold approaches $4,500 as record-setting rally continues

Gold builds on Monday's impressive gains and advances toward $4,500, setting fresh record-highs along the way. Heightened geopolitical tensions, combined with the broad-based US Dollar (USD) weakness ahead of the Q3 GDP data, help XAU/USD preserve its bullish momentum.

Uniswap holds above $6 as traders eye UNIfication vote outcome

Uniswap price holds above $6 at the time of writing on Tuesday after closing above a key resistance zone in the previous week. Traders are focusing on the highly anticipated UNIfication proposal, which is set to conclude on Thursday, and could become a key near-term catalyst. On the technical side, momentum indicators are flashing bullish signals, hinting at an upside rally.

Ten questions that matter going into 2026

2026 may be less about a neat “base case” and more about a regime shift—the market can reprice what matters most (growth, inflation, fiscal, geopolitics, concentration). The biggest trap is false comfort: the same trades can look defensive… right up until they become crowded.

XRP steadies above $1.90 support as fund inflows and retail demand rise

Ripple (XRP) is stable above support at $1.90 at the time of writing on Monday, after several attempts to break above the $2.00 hurdle failed to materialize last week. Meanwhile, institutional interest in the cross-border remittance token has remained steady.