|

Elliott Wave View: Rally in Exxon Mobil (XOM) should find sellers [Video]

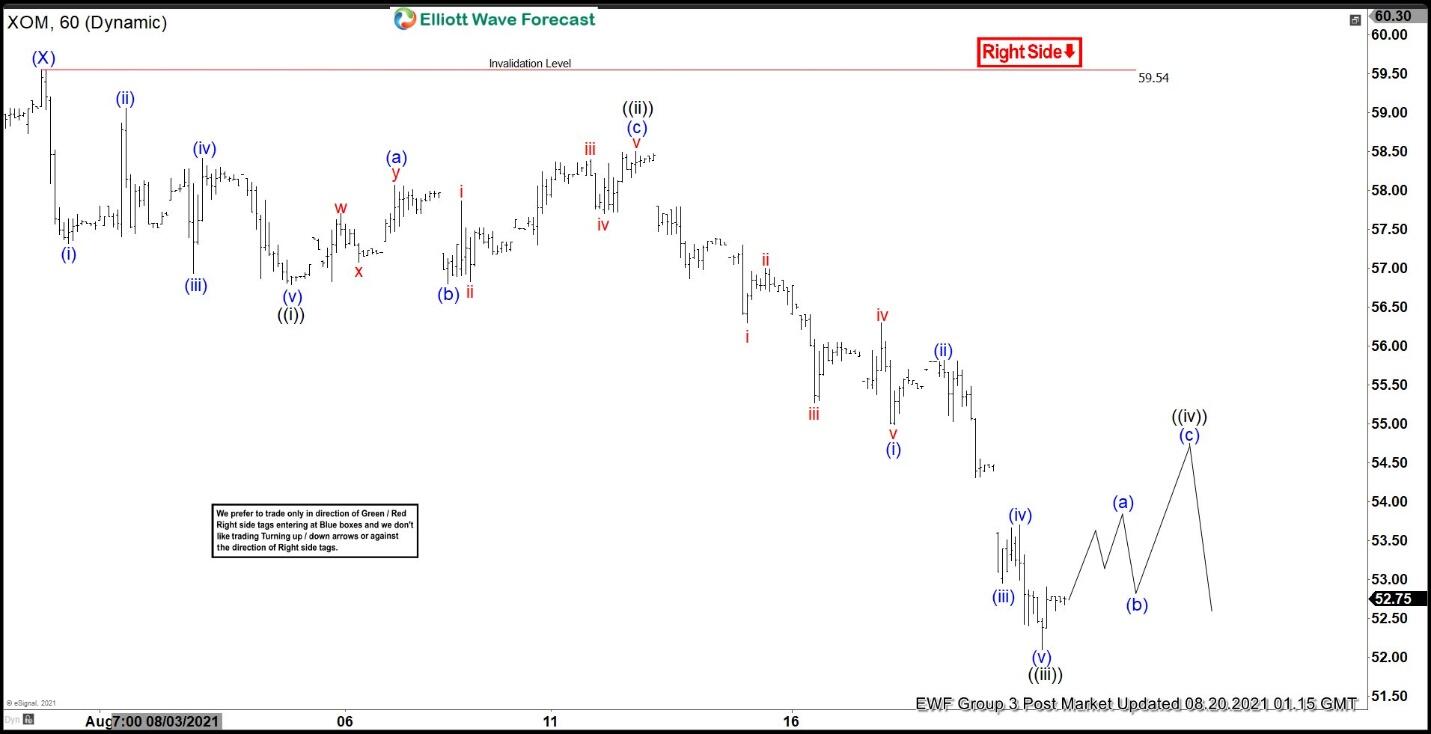
Short-term Elliott wave view in Exxon Mobil (XOM) suggests that the cycle from June 25, 2021 high is unfolding as a double three Elliott Wave structure. Down from June 25, wave (W) ended at 54.59 and rally in wave (X) ended at 59.33. The stock has broken below wave (W), creating an incomplete bearish sequence from June 25 peak favoring more downside. The break below wave (W) also confirms that wave (Y) lower is in progress.

Internal subdivision of wave (Y) is unfolding as a zigzag in lesser degree. Down from wave (X), wave ((i)) ended at 56.79 and rally in wave ((ii)) ended at 58.50. The stock then extended lower in wave ((iii)) towards 52.10. Expect rally in wave ((iv)) to fail in 3, 7, or 11 swing for further downside in wave ((v)) of A. Then it should correct the entire 5 waves down in larger degree wave B before the decline resumes. Potential target for wave ((iv)) correction is 23.6 – 38.2% Fibonacci retracement of wave ((iii)) at 53.62 – 54.55. Near term, as far as pivot at 59.54 high remains intact, expect rally to fail in 3, 7, or 11 swing for further downside.

Exxon Mobil (XOM) 60 Minutes Elliott Wave Chart

XOM Elliott Wave Video

Premium

You have reached your limit of 3 free articles for this month.

Start your subscription and get access to all our original articles.

Subscribe to PremiumSign In

Author

Elliott Wave Forecast Team

Elliott Wave Forecast Team

ElliottWave-Forecast.com

More from Elliott Wave Forecast Team
Share:

Markets move fast. We move first.

Orange Juice Newsletter brings you expert driven insights - not headlines. Every day on your inbox.

By subscribing you agree to our Terms and conditions.

Editor's Picks

EUR/USD clings to small gains near 1.1750

Following a short-lasting correction in the early European session, EUR/USD regains its traction and clings to moderate gains at around 1.1750 on Monday. Nevertheless, the pair's volatility remains low, with investors awaiting this weeks key data releases from the US and the ECB policy announcements.

GBP/USD edges higher toward 1.3400 ahead of US data and BoE

GBP/USD reverses its direction and advances toward 1.3400 following a drop to the 1.3350 area earlier in the day. The US Dollar struggles to gather recovery momentum as markets await Tuesday's Nonfarm Payrolls data, while the Pound Sterling holds steady ahead of the BoE policy announcements later in the week.

Gold stuck around $4,300 as markets turn cautious

Gold loses its bullish momentum and retreats below $4,350 after testing this level earlier on Monday. XAU/USD, however, stays in positive territory as the US Dollar remains on the back foot on growing expectations for a dovish Fed policy outlook next year.

Solana consolidates as spot ETF inflows near $1 billion signal institutional dip-buying

Solana price hovers above $131 at the time of writing on Monday, nearing the upper boundary of a falling wedge pattern, awaiting a decisive breakout. On the institutional side, demand for spot Solana Exchange-Traded Funds remained firm, pushing total assets under management to nearly $1 billion since launch. 

Big week ends with big doubts

The S&P 500 continued to push higher yesterday as the US 2-year yield wavered around the 3.50% mark following a Federal Reserve (Fed) rate cut earlier this week that was ultimately perceived as not that hawkish after all. The cut is especially boosting the non-tech pockets of the market.

Solana Price Forecast: SOL consolidates as spot ETF inflows near $1 billion signal institutional dip-buying

Solana (SOL) price hovers above $131 at the time of writing on Monday, nearing the upper boundary of a falling wedge pattern, awaiting a decisive breakout.