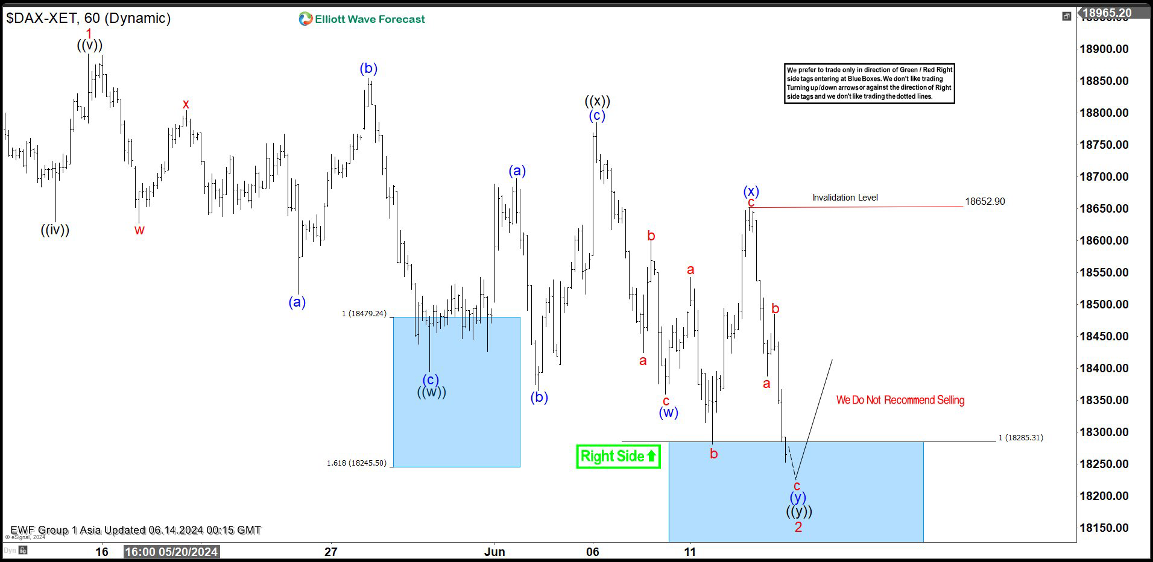
Short term Elliott Wave in DAX suggests the Index is correcting cycle from 4.19.2024 low. The rally from 4.19.2024 low ended wave 1 at 18892.92. Wave 2 pullback is currently in progress as a double three Elliott Wave structure. Down from wave 1, wave (a) ended at 18515.84 and wave (b) ended at 18855.05. Wave (c) lower ended at 18394.43 which completed wave ((w)) in higher degree. Wave ((x)) unfolded as an expanded flat Elliott Wave structure. Up from wave ((w)), wave (a) ended at 18697.09 and wave (b) ended at 18365.53. Wave (c) higher ended at 18784.65 which completed wave ((x)) in higher degree.
The Index has resumed lower in wave ((y)). Down from wave ((x)), wave (w) ended at 18359.42 and wave (x) rally ended at 18652.90. Wave (y) lower is now in progress to complete wave ((y)) of 2 in higher degree. The Index has reached the extreme area from wave 1 peak. This area of support is at 100% – 161.8% Fibonacci extension of wave ((w)), which comes at 17981 – 18287.2. From this area, the Index should turn and resume higher or at minimum rally in 3 waves.
DAX 60 minutes Elliott Wave chart
DAX Elliott Wave [Video]
FURTHER DISCLOSURES AND DISCLAIMER CONCERNING RISK, RESPONSIBILITY AND LIABILITY Trading in the Foreign Exchange market is a challenging opportunity where above average returns are available for educated and experienced investors who are willing to take above average risk. However, before deciding to participate in Foreign Exchange (FX) trading, you should carefully consider your investment objectives, level of xperience and risk appetite. Do not invest or trade capital you cannot afford to lose. EME PROCESSING AND CONSULTING, LLC, THEIR REPRESENTATIVES, AND ANYONE WORKING FOR OR WITHIN WWW.ELLIOTTWAVE- FORECAST.COM is not responsible for any loss from any form of distributed advice, signal, analysis, or content. Again, we fully DISCLOSE to the Subscriber base that the Service as a whole, the individual Parties, Representatives, or owners shall not be liable to any and all Subscribers for any losses or damages as a result of any action taken by the Subscriber from any trade idea or signal posted on the website(s) distributed through any form of social-media, email, the website, and/or any other electronic, written, verbal, or future form of communication . All analysis, trading signals, trading recommendations, all charts, communicated interpretations of the wave counts, and all content from any media form produced by www.Elliottwave-forecast.com and/or the Representatives are solely the opinions and best efforts of the respective author(s). In general Forex instruments are highly leveraged, and traders can lose some or all of their initial margin funds. All content provided by www.Elliottwave-forecast.com is expressed in good faith and is intended to help Subscribers succeed in the marketplace, but it is never guaranteed. There is no “holy grail” to trading or forecasting the market and we are wrong sometimes like everyone else. Please understand and accept the risk involved when making any trading and/or investment decision. UNDERSTAND that all the content we provide is protected through copyright of EME PROCESSING AND CONSULTING, LLC. It is illegal to disseminate in any form of communication any part or all of our proprietary information without specific authorization. UNDERSTAND that you also agree to not allow persons that are not PAID SUBSCRIBERS to view any of the content not released publicly. IF YOU ARE FOUND TO BE IN VIOLATION OF THESE RESTRICTIONS you or your firm (as the Subscriber) will be charged fully with no discount for one year subscription to our Premium Plus Plan at $1,799.88 for EACH person or firm who received any of our content illegally through the respected intermediary’s (Subscriber in violation of terms) channel(s) of communication.
Recommended content
Editors’ Picks

EUR/USD clings to gains above 1.1500
Following the U-turn in the US Dollar, EUR/USD rose to the 1.1550 region on Monday, where a decent resistance seems to have emerged so far. In the meantime, the Greenback continues to suffer the dovish message from FOMC’s Bowman, while geopolitical concerns continue to limit the downside.

Could Iran block the Strait of Hormuz? Why Oil is on edge after US strikes
As the Israel-Iran conflict reaches new heights, an old threat is coming back to haunt the markets: that of the closure of the Strait of Hormuz. This narrow arm of the sea in the Persian Gulf, wedged between Iran to the north and the United Arab Emirates and Oman to the south, is much more than a simple sea passage.

Gold treads water below $3,400 on stronger USD
Gold begins the week on a downward trend, trading below the key $3,400 mark per troy ounce. In the meantime, the precious metal has managed to limit its losses amid the stronger US Dollar (USD) and rising geopolitical tensions in the Middle East.

AI Tokens Price Prediction: Story, Virtuals Protocol rebound following sell-off after US strikes on Iran
Geopolitical tensions in the Middle East caused a liquidation havoc of over $1 billion in the cryptocurrency market over the weekend, following US President Donald Trump’s direct involvement in the conflict between Israel and Iran.

GBP/USD climbs to daily highs around 1.3480
After bottoming out in multi-week lows near 1.3370, GBP/USD now picks up pace and gains around a cent to hit new daily peaks around 1.3480 in response to fresh selling pressure hitting the Greenback. The knee-jerk in the US Dollar comes despite steady fears on the Iran-Israel-US front and firm results from preliminary US PMIs for the month of June. On the UK docket, all the attention remains on upcoming flash Manufacturing and Services PMIs.

The Best brokers to trade EUR/USD
SPONSORED Discover the top brokers for trading EUR/USD in 2025. Our list features brokers with competitive spreads, fast execution, and powerful platforms. Whether you're a beginner or an expert, find the right partner to navigate the dynamic Forex market.