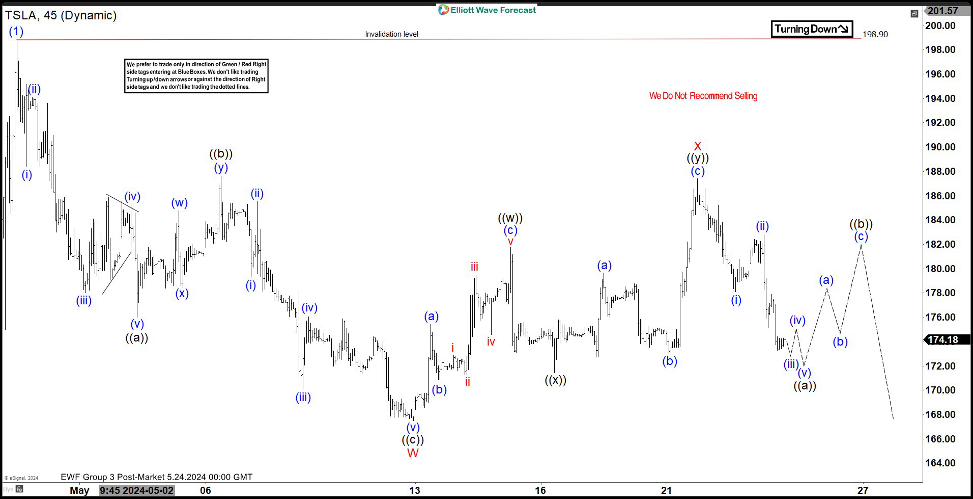
Short term Elliott Wave in Tesla (TSLA) suggests the rally from 4.22.2024 low is in progress as an impulse. Up from 4.22.2024 low, wave (1) ended at 198.90 as the 45 minutes chart below shows. Wave (2) pullback is currently in progress. The internal subdivision of wave (2) takes the form of a double three Elliott Wave structure. Down from wave (2), wave (i) ended at 188.35 and wave (ii) ended at 194.54. The stock extended lower in wave (iii) towards 178.03 and wave (iv) ended at 185.26. Final leg wave (v) ended at 176.02 which completed wave ((a)). Rally in wave ((b)) ended at 187.56 as a double three.

Wave ((c)) lower is in progress as 5 waves and ended at 167.50. This completed wave W in higher degree. Wave X rally takes the form of a double three Elliott Wave structure. Up from wave W, wave ((w)) ended at 181.8 and pullback in wave ((x)) ended at 171.43. Wave ((y)) higher ended at 187.42 which completed wave X. The stock has turned lower in wave Y. Down from wave X, wave (i) ended at 178.1 and wave (ii) ended at 182.8. Near term, as far as pivot at 198.9 high stays intact, expect the stock to extend lower.

Tesla (TSLA) 45 minutes Elliott Wave chart

TSLA Elliott Wave [Video]


Share: Feed news

FURTHER DISCLOSURES AND DISCLAIMER CONCERNING RISK, RESPONSIBILITY AND LIABILITY Trading in the Foreign Exchange market is a challenging opportunity where above average returns are available for educated and experienced investors who are willing to take above average risk. However, before deciding to participate in Foreign Exchange (FX) trading, you should carefully consider your investment objectives, level of xperience and risk appetite. Do not invest or trade capital you cannot afford to lose. EME PROCESSING AND CONSULTING, LLC, THEIR REPRESENTATIVES, AND ANYONE WORKING FOR OR WITHIN WWW.ELLIOTTWAVE- FORECAST.COM is not responsible for any loss from any form of distributed advice, signal, analysis, or content. Again, we fully DISCLOSE to the Subscriber base that the Service as a whole, the individual Parties, Representatives, or owners shall not be liable to any and all Subscribers for any losses or damages as a result of any action taken by the Subscriber from any trade idea or signal posted on the website(s) distributed through any form of social-media, email, the website, and/or any other electronic, written, verbal, or future form of communication . All analysis, trading signals, trading recommendations, all charts, communicated interpretations of the wave counts, and all content from any media form produced by www.Elliottwave-forecast.com and/or the Representatives are solely the opinions and best efforts of the respective author(s). In general Forex instruments are highly leveraged, and traders can lose some or all of their initial margin funds. All content provided by www.Elliottwave-forecast.com is expressed in good faith and is intended to help Subscribers succeed in the marketplace, but it is never guaranteed. There is no “holy grail” to trading or forecasting the market and we are wrong sometimes like everyone else. Please understand and accept the risk involved when making any trading and/or investment decision. UNDERSTAND that all the content we provide is protected through copyright of EME PROCESSING AND CONSULTING, LLC. It is illegal to disseminate in any form of communication any part or all of our proprietary information without specific authorization. UNDERSTAND that you also agree to not allow persons that are not PAID SUBSCRIBERS to view any of the content not released publicly. IF YOU ARE FOUND TO BE IN VIOLATION OF THESE RESTRICTIONS you or your firm (as the Subscriber) will be charged fully with no discount for one year subscription to our Premium Plus Plan at $1,799.88 for EACH person or firm who received any of our content illegally through the respected intermediary’s (Subscriber in violation of terms) channel(s) of communication.

Recommended content


Recommended content

Editors’ Picks

EUR/USD: Central banks’ decisions will keep taking their toll

EUR/USD: Central banks’ decisions will keep taking their toll

The EUR/USD pair slid below the 1.0700 mark for the first time in over a month on Friday, as the US Dollar surged on the back of risk aversion. The dismal mood prevailed throughout the week, with a short-lived exception on Wednesday when softer-than-anticipated United States inflation brought a breath of fresh air.

EUR/USD News

GBP/USD slumps to multi-week lows below 1.2700

GBP/USD slumps to multi-week lows below 1.2700

GBP/USD extends its decline on Friday and trades at its lowest level in nearly a month below 1.2700. In the absence of high-tier data releases, the US Dollar continues to benefit from souring market mood, forcing the pair to stretch lower in the second half of the day.

GBP/USD News

Gold clings to recovery gains at around $2,330

Gold clings to recovery gains at around $2,330

Following Thursday's pullback, Gold holds its ground on Friday and trades in positive territory near $2,330. The benchmark 10-year US Treasury bond yield edges lower toward 4.2%, helping XAU/USD push higher ahead of the weekend.

Gold News

Monero price poised for a downward correction

Monero price poised for a downward correction

Monero price has encountered resistance at a critical level. The technical outlook suggests a potential short-term correction as momentum indicators signal a bearish divergence.

Read more

Week ahead: RBA, SNB and BoE next to decide, CPI and PMI data also on tap

Week ahead: RBA, SNB and BoE next to decide, CPI and PMI data also on tap

It will be another central-bank-heavy week with the RBA, SNB and BoE. Retail sales will be the highlight in the United States. Plenty of other data also on the way, including flash PMIs and UK CPI.

Read more

Forex MAJORS

Cryptocurrencies

Signatures