|premium|

Elliott Wave Analysis Offers Insight into LVS’s Potential Trajectory

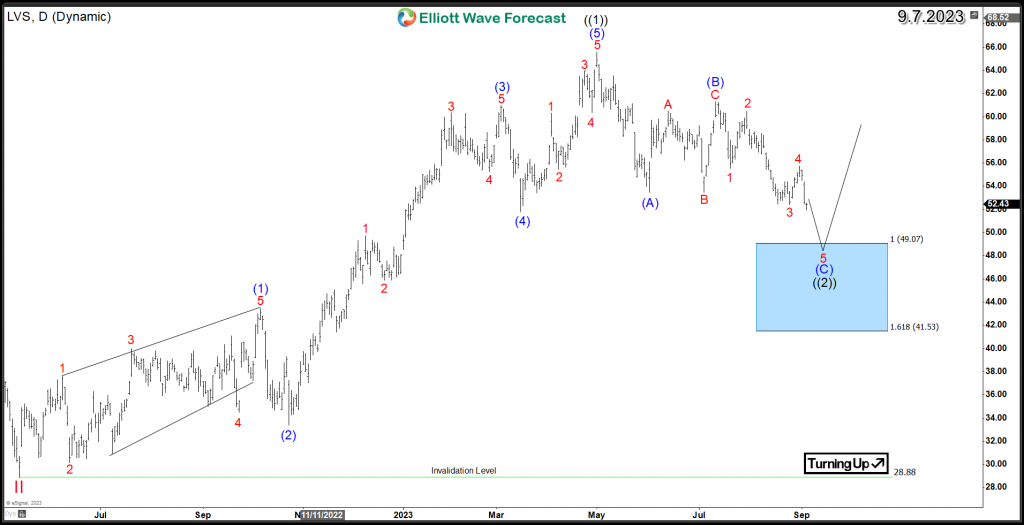
Las Vegas Sands Corp. (NYSE: LVS), a prominent player in the global integrated resort industry, has seen its fortunes shift amidst changing landscapes in the world of entertainment and hospitality. This article delves into the present Elliott Wave analysis for the stock, exploring two potential pathways based on Elliott Wave Theory and future prospects. Examining LVS’s daily chart, the rally that commenced in May 2022 unfolded as an impulsive 5-wave advance, reaching $65.5 in May 2023 to mark wave ((1)). Although the year-long rally didn’t surpass the 2018 peak of $81, it created a bullish structure.

LVS is presently engaged in correcting the prior daily cycle within wave ((2)) and initiating an initial 3-wave pullback through a Zigzag structure. This descent, consisting of 3 swings, is targeted towards the blue box area, located at equal legs $49 – $41. At this point, LVS anticipates two potential scenarios:

  1.  A strong and impulsive rebound, enabling buyers to initiate the subsequent upswing within wave ((3)) and potentially break into new all-time highs.
  2. A corrective bounce that fails to surpass the May peak, followed by another 3-wave descent, forming a larger double-three correction ( 7 swings ) within wave ((2)). Subsequently, the stock may resume its upward trajectory in wave ((3)).

Both scenarios are expected to remain above the 2022 low $28.88 to allow the stock to resume higher within the bullish trend. Investors will be looking to use the High-frequency Blue Box areas where the market is likely to end cycles and make a turn.

LVS Daily Chart 9.7.2023

Premium

You have reached your limit of 3 free articles for this month.

Start your subscription and get access to all our original articles.

Subscribe to PremiumSign In

Author

Elliott Wave Forecast Team

Elliott Wave Forecast Team

ElliottWave-Forecast.com

More from Elliott Wave Forecast Team
Share:

Editor's Picks

EUR/USD struggles near 1.1850, with all eyes on US CPI data

EUR/USD holds losses while keeping its range near 1.1850 in European trading on Friday. A broadly cautious market environment paired with a steady US Dollar undermines the pair ahead of the critical US CPI data. Meanwhile, the Eurozone Q4 GDP second estimate has little to no impact on the Euro. 

GBP/USD recovers above 1.3600, awaits US CPI for fresh impetus

GBP/USD recovers some ground above 1.3600 in the European session on Friday, though it lacks bullish conviction. The US Dollar remains supported amid a softer risk tone and ahead of the US consumer inflation figures due later in the NA session on Friday. 

Gold remains below $5,000 as US inflation report looms

Gold retreats from the vicinity of the $5,000 psychological mark, though sticks to its modest intraday gains in the European session. Traders now look forward to the release of the US consumer inflation figures for more cues about the Fed policy path. The outlook will play a key role in influencing the near-term US Dollar price dynamics and provide some meaningful impetus to the non-yielding bullion.

US CPI data set to show modest inflation cooling as markets price in a more hawkish Fed

The US Bureau of Labor Statistics will publish January’s Consumer Price Index data on Friday, delayed by the brief and partial United States government shutdown. The report is expected to show that inflationary pressures eased modestly but also remained above the Federal Reserve’s 2% target.

A tale of two labour markets: Headline strength masks underlying weakness

Undoubtedly, yesterday’s delayed US January jobs report delivered a strong headline – one that surpassed most estimates. However, optimism quickly faded amid sobering benchmark revisions.

Solana Price Forecast: Mixed market sentiment caps recovery

Solana (SOL) is trading at $79 as of Friday, following a correction of over 9% so far this week. On-chain and derivatives data indicates mixed sentiment among traders, further limiting the chances of a price recovery.