DRREDDY Indian Stocks Elliott Wave technical analysis [Video]
![DRREDDY Indian Stocks Elliott Wave technical analysis [Video]](https://editorial.fxsstatic.com/images/i/nvidia-01.jpg)
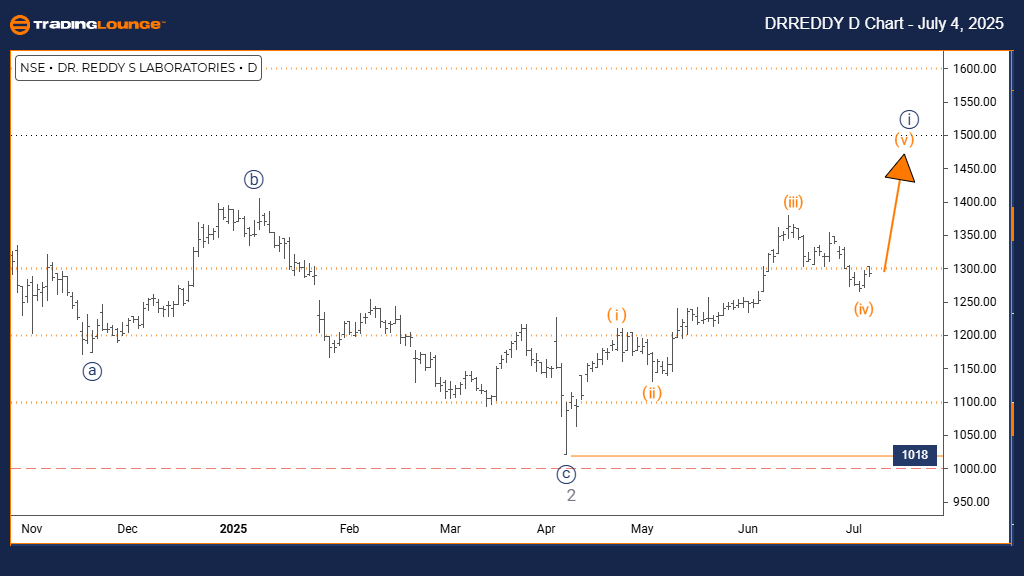
DR REDDY Laboratories Elliott Wave technical analysis
-
Function: Trend.
-
Mode: Impulsive.
-
Structure: Orange Wave 5.
-
Position: Navy Blue Wave 1.
-
Direction next lower degrees: Navy Blue Wave 2.
-
Details: Orange Wave 4 appears complete; Orange Wave 5 is in progress.
-
Wave cancel invalid Level: 1018.
On the daily chart of DR REDDY LABORATORIES, Elliott Wave analysis points to a bullish trend. The price movement is currently in an impulsive phase, signaling strong upward momentum. The active wave structure is orange wave 5, which belongs to a larger formation — navy blue wave 1. This wave positioning indicates the stock is in the final leg of an impulsive advance within a broader upward trend.
The analysis further suggests that orange wave 4 has likely ended its corrective phase, paving the way for orange wave 5. This wave is often the final phase of an Elliott Wave impulse and is typically characterized by accelerated price movement. The next expected development is a corrective move, categorized as navy blue wave 2, to follow the conclusion of the current orange wave 5.
One crucial level to monitor is 1018, the wave cancellation invalidation point. A drop below this level would nullify the current Elliott Wave outlook, prompting a reassessment of the bullish setup. However, as long as the price remains above this threshold, the existing structure supports a continuation of the upward trend.
With orange wave 5 now active, following the confirmed end of orange wave 4, DR REDDY LABORATORIES seems positioned for a final upward thrust. Given the impulsive nature of wave 5, ongoing buying interest is expected. Yet, traders should also watch for potential reversal signals as this marks the end of the fifth wave within navy blue wave 1.
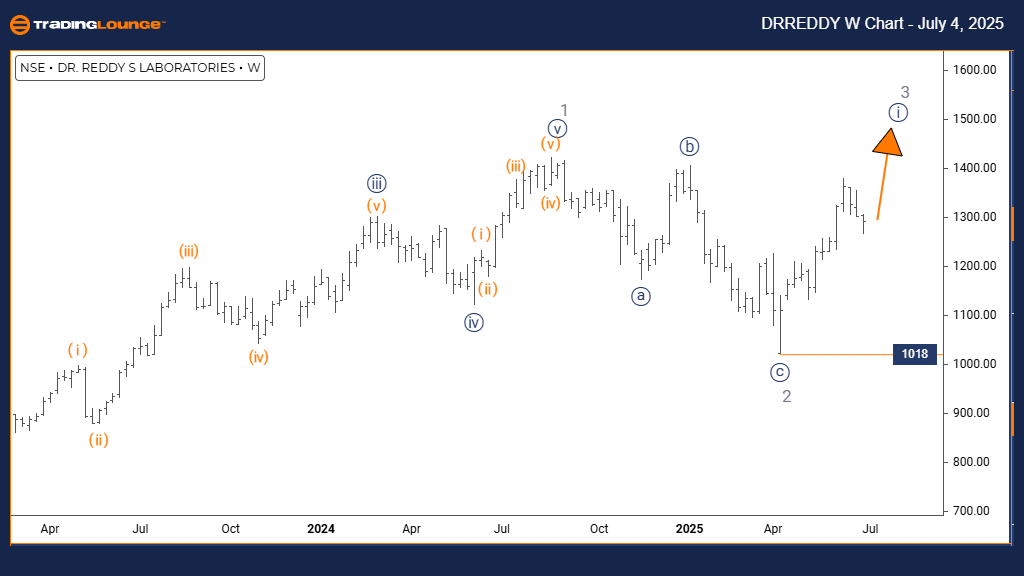
DR REDDY Laboratories Elliott Wave technical analysis
-
Function: Trend.
-
Mode: Impulsive.
-
Structure: Navy Blue Wave 1.
-
Position: Gray Wave 3.
-
Direction next lower degrees: Navy Blue Wave 2.
-
Details: Gray Wave 2 appears complete; Navy Blue Wave 1 is underway.
-
Wave cancel invalid level: 1018.
The weekly Elliott Wave chart for DR REDDY LABORATORIES presents a clear bullish trend, with price action currently in an impulsive phase, reflecting strong upward pressure. The active wave structure is navy blue wave 1, which belongs to a broader pattern defined by gray wave 3. This setup implies the early stage of what may become a notable uptrend in a continuing bullish cycle.
Analysis indicates that gray wave 2 has completed its correction, signaling the beginning of navy blue wave 1. This wave initiates the third wave sequence in Elliott Wave theory, often the strongest and most aggressive phase. Once navy blue wave 1 concludes, a corrective wave, known as navy blue wave 2, is expected to follow.
A key technical threshold to monitor is the invalidation level at 1018. A move below this point would invalidate the current wave count and necessitate a reevaluation of the trend. Unless this level is breached, the current wave structure supports further upward movement.
With navy blue wave 1 now progressing and gray wave 2 confirmed complete, DR REDDY LABORATORIES appears positioned for substantial gains. The impulsive traits of the current wave reflect strong institutional interest, hinting at sustained bullish momentum in the coming weeks within the larger gray wave 3 framework.
DR REDDY Laboratories Elliott Wave technical analysis [Video]
Author

Peter Mathers
TradingLounge
Peter Mathers started actively trading in 1982. He began his career at Hoei and Shoin, a Japanese futures trading company.


