Dow (YM) rockets higher from extreme zone – Bull run continues

Dow (YM) Futures bounced from the extreme support zone and broke to new highs, extending April’s bullish cycle. This post shows how our Elliottwave analysis positioned members ahead of the move—spotting the setup before the breakout.
Following the end of the February 2025 pullback that corrected the bullish cycle from October 2022, a new bullish cycle started on 7th April 2025. This cycle marked the 5th wave of the long term bullish cycle from March 2020. The April 2025 bullish cycle broke into a new high on 28th July 2025. Following this breakout, we recommended to members to buy at the extreme of the 3/7/11 swing pullback. Our system focuses on buy pullbacks within a bullish trend. Likewise, when the sequence is bearish, we prefer to sell at the extreme of corrective bounces. However, we do not just trade any structures. We like to trade off the extreme of a zigzag/double zigzag/triple zigzag corrective structure. We traded the double
Understanding the double zigzag (7-swing structure) in Elliott Wave theory
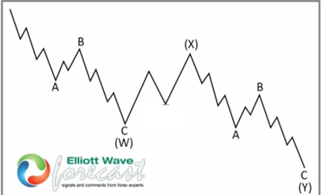
In Elliott Wave analysis, a double zigzag is a complex corrective pattern that helps the market correct deeper than a single zigzag. It’s labeled as W-X-Y, where:
- W and Y are both zigzag structures (5-3-5).
- X is a connecting wave, often a simple corrective move.
Key traits of a double zigzag:
- It appears in corrective phases, especially when the market needs to retrace more aggressively.
- The second zigzag (Y) often reaches the 100% of W from X.
- It’s more directional than other complex corrections, making it easier to trade with proper wave identification.
After the Dow (YM) marginally reached a new high in July, it pulled back and rallied again in a clear 5-wave structure. Thus, on the shorter cycle, we waited for a perfect 3/7/11 swing and recommended to members to buy at the extreme.
YM Elliott Wave analysis – 22 August 2025 update

On 22nd August, we shared the chart above showing a 7-swing pullback for wave 2 of (5). The wave (5) is to be the 5th wave of the April cycle. While incomplete, we decided to buy at the extreme of the wave 2 of (5), anticipating to profit off wave 3 of (5) rallies. Price reached the 44757-44422 buying zone and bounced sharply as the chart below shows.
YM Elliott Wave analysis – 23 August 2025 update
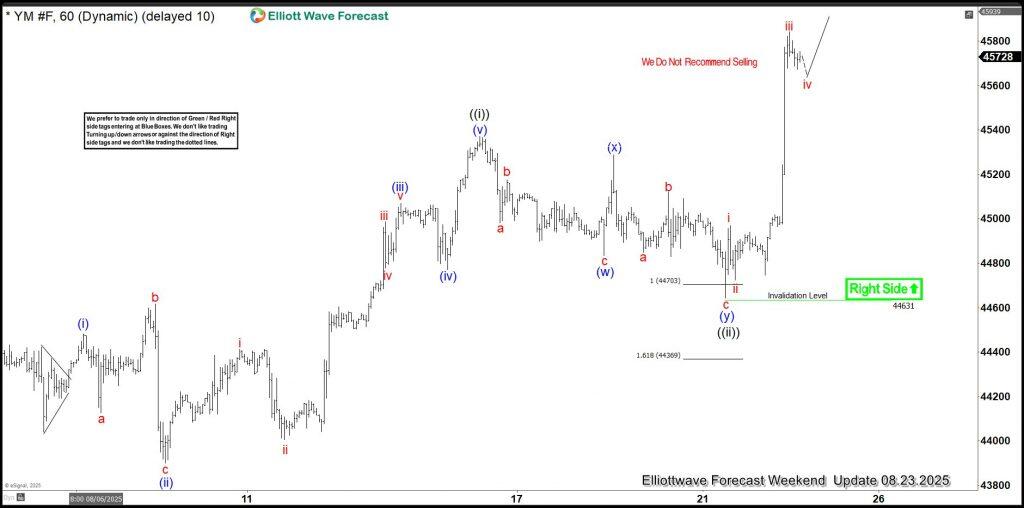
The chart above is the H1 23-August weekend update we shared to members. A perfect reaction from the extreme zone put buyers in good profit while anticipating for more. Going into the new week, we will still anticipate support from the extreme of a 3/7/11 swing pullback toward a new high. We will alert members with new H1 charts several times a day, as price action develops.
Author

Elliott Wave Forecast Team
ElliottWave-Forecast.com


