Dow Jones Industrial Average moonshots on US-China tariff walkback
- The Dow Jones soared over a thousand points from last week’s closing prices following opening US-China trade talks over the weekend.
- US tariffs on Chinese goods are being lowered to 30%, while Chinese tariffs on US imports are being cut to 10%.
- The temporary tariff cuts are set to come into effect from Tuesday and last 90 days.

The Dow Jones Industrial Average (DJIA) surged higher on Monday, rising over 1,100 points and climbing back above 42,400 for the first time since early April. Steep (albeit temporary) cuts to triple-digit tariffs going in both directions between the United States (US) and China have bolstered investor confidence that the Trump administration will continue to grind away at its own trade policy stance.
Markets get a tariff reprieve…for now
The US and China both agreed to trim their tit-for-tat tariffs on all imports going in both directions for the next 90 days. The US will continue to charge a flat 10% “universal” tariff, as well as an additional 20% tacked on due to the fentanyl epidemic. Despite the amount of US spending on policing and border control, the Trump administration continues to lay responsibility for the drug crisis at the feet of foreign governments. China has agreed to trim its tariffs on US goods to 10% for the 90-day period.
Tariff cuts come at a crucial time: the first batch of US inflation data that includes the start of the Trump administration’s sweeping ‘reciprocal’ tariffs is set to be released this week. US Consumer Price Index (CPI) inflation for the month of April will be released on Tuesday, with median market forecasts expecting an uptick in both headline and core CPI inflation measures for the month. YoY CPI is still expected to hold steady over the previous annualized period, with core CPI forecast to hold flat at 2.8% YoY.
Core CPI inflation has remained stuck above the Federal Reserve’s (Fed) target inflation rate of 2% for four straight years. Despite coming down significantly from a decades-long peak of 6.6% in 2022, the Fed has struggled to deliver interest rate cuts as quickly as markets would like them. Progress on getting inflation down to target has largely stalled out, according to policymakers at the Fed, and market expectations of a rate cut as early as July have tumbled.
Rate cut hopes get pushed back another month
The majority of rate traders now expect the Fed to continue holding policy rates flat until at least September. According to the CME’s FedWatch Tool, rate markets are pricing in nearly 60% odds that the Fed will stay the course in July, a sharp reversal from better-than-even of a quarter-point rate cut on July 30 that persisted until as recently as last week.
Read more stock news:
NASDAQ futures surge 4% as Trump curtails China tariffs for 90 days
Nike stock holds onto rally after lowered China tariffs
Dow Jones price forecast
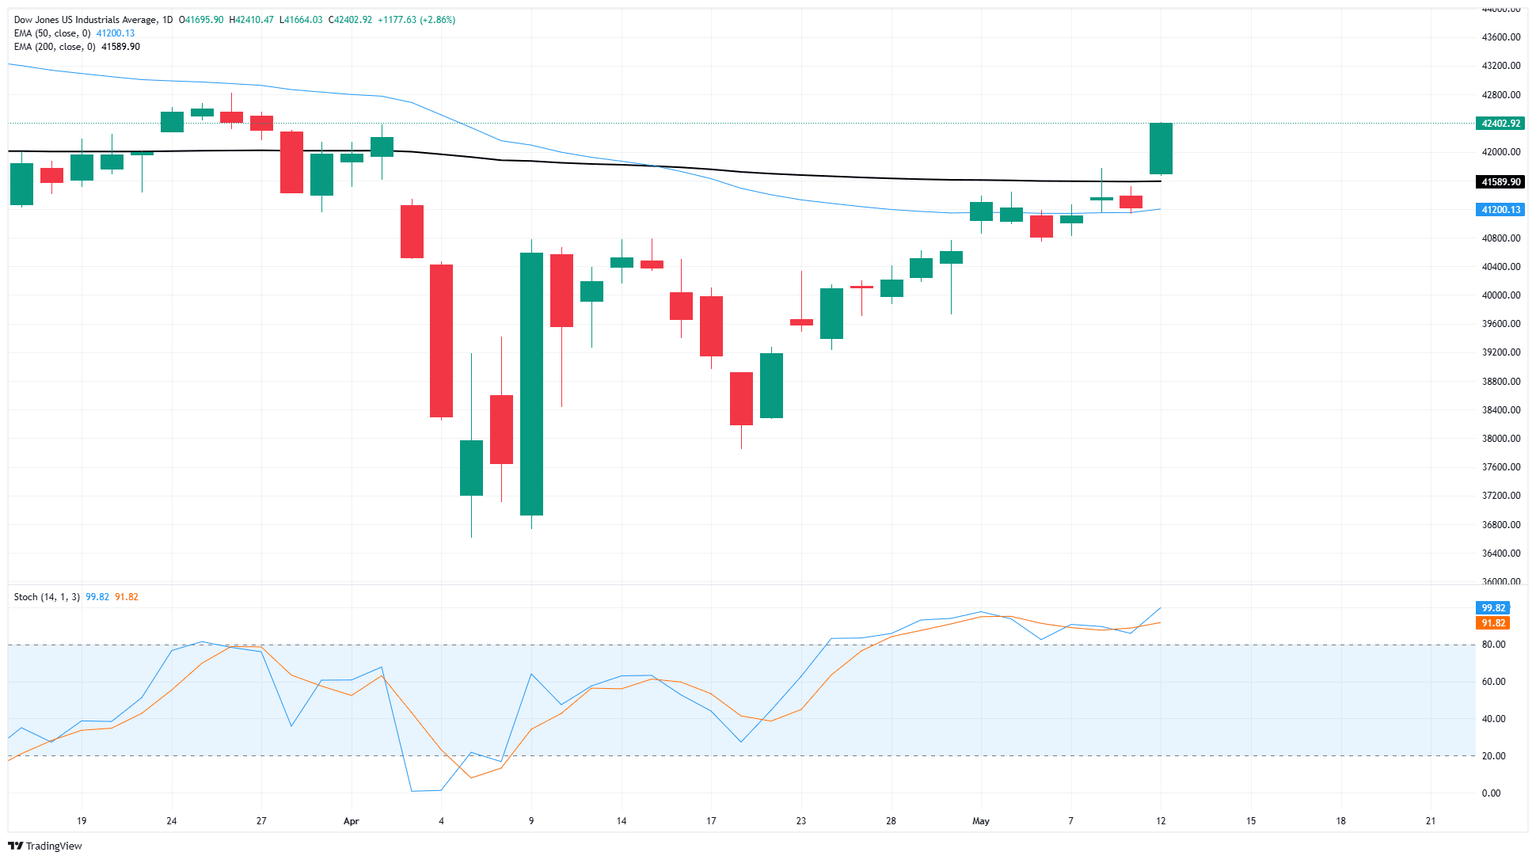
Monday’s tariff-off rally has bolstered the Dow Jones back above the 200-day Exponential Moving Average (EMA) near 41,500 for the first time since early April and pushed the DJIA north of the 42,000 major price handle in the process. The Dow has recovered nearly 16% after bottoming out near 36,600 following the post-tariff announcement plunge on April 2. However, the major equity index is still 6% away from reclaiming all-time highs north of the 45,000 level.
Dow Jones daily chart
Dow Jones FAQs
The Dow Jones Industrial Average, one of the oldest stock market indices in the world, is compiled of the 30 most traded stocks in the US. The index is price-weighted rather than weighted by capitalization. It is calculated by summing the prices of the constituent stocks and dividing them by a factor, currently 0.152. The index was founded by Charles Dow, who also founded the Wall Street Journal. In later years it has been criticized for not being broadly representative enough because it only tracks 30 conglomerates, unlike broader indices such as the S&P 500.
Many different factors drive the Dow Jones Industrial Average (DJIA). The aggregate performance of the component companies revealed in quarterly company earnings reports is the main one. US and global macroeconomic data also contributes as it impacts on investor sentiment. The level of interest rates, set by the Federal Reserve (Fed), also influences the DJIA as it affects the cost of credit, on which many corporations are heavily reliant. Therefore, inflation can be a major driver as well as other metrics which impact the Fed decisions.
Dow Theory is a method for identifying the primary trend of the stock market developed by Charles Dow. A key step is to compare the direction of the Dow Jones Industrial Average (DJIA) and the Dow Jones Transportation Average (DJTA) and only follow trends where both are moving in the same direction. Volume is a confirmatory criteria. The theory uses elements of peak and trough analysis. Dow’s theory posits three trend phases: accumulation, when smart money starts buying or selling; public participation, when the wider public joins in; and distribution, when the smart money exits.
There are a number of ways to trade the DJIA. One is to use ETFs which allow investors to trade the DJIA as a single security, rather than having to buy shares in all 30 constituent companies. A leading example is the SPDR Dow Jones Industrial Average ETF (DIA). DJIA futures contracts enable traders to speculate on the future value of the index and Options provide the right, but not the obligation, to buy or sell the index at a predetermined price in the future. Mutual funds enable investors to buy a share of a diversified portfolio of DJIA stocks thus providing exposure to the overall index.
Author

Joshua Gibson
FXStreet
Joshua joins the FXStreet team as an Economics and Finance double major from Vancouver Island University with twelve years' experience as an independent trader focusing on technical analysis.


