NASDAQ futures surge 4% as Trump curtails China tariffs for 90 days


  • Trump administration agrees to 90-day pause on higher tariff levels with China.
  • Both nations will lower current tariff rate by 115 percentage points.
  • NASDAQ 100 Futures spike above 4.1% in the premarket.
  • US Treasury Secretary says Trump administration aims for "strategic decoupling" with China.

US stocks on Monday are thrilling to the Trump administration's tariff pause with China over the weekend. US Treasury Secretary Scott Bessent walked away from talks in Switzerland with an agreement by the US and China to each reduce their bilateral tariffs by 115 percentage points.

This will move US tariffs on Chinese goods from 145% to 30% and Chinese tariffs on US goods from 125% to 10% for a period of 90 days while trade talks continue. The US' 30% tariff is made up of a 10% tariff similar to what the Trump administration has placed on other trading partners, alongside the earlier 20% "fentanyl" tariff that is staying put.

In remarks on Bloomberg Television on Monday morning before the bell, Bessent said that the US was aiming for a "strategic decoupling" between the US and Chinese economies rather than a "general decoupling". Bessent said a final agreement would involve China consuming more US goods and the US reshoring more factory production.

NASDAQ 100 futures have shot up 4.1% an hour before the market open, while the Dow Jones futures gain 2.7%. The S&P 500 futures spiked 3.2%.

Walmart (WMT), set to unveil quarterly earnings on Thursday, advanced 2.25%. Nike (NKE) shares, which source production and raw materials extensively from China and Vietnam, surged 6.6%.

Tech is leading the charge in the premarket. Apple (AAPL) stock jumped 6.6% as the company said it would raise iPhone prices with the claim that hike was due to new features and not tariffs. Amazon (AMZN) stock surged 8.5%, while Nvidia (NVDA) advanced 4.6%.

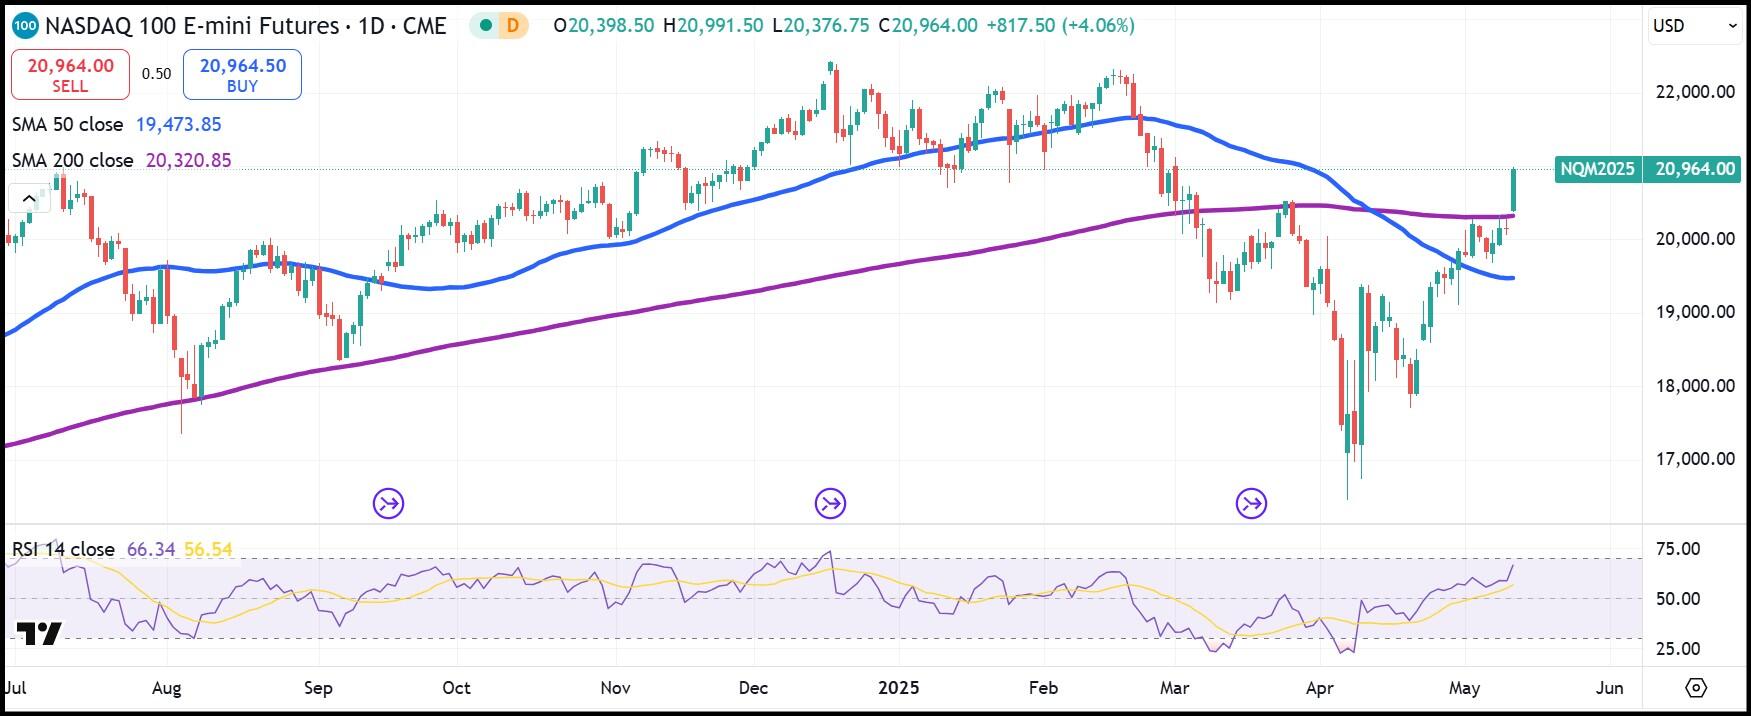
NASDAQ futures chart

NASDAQ 100 E-mini futures broke well above the 200-day Simple Moving Average on Monday after overcoming the 50-day SMA on April 30. Already above 20,900, the market dynamic demonstrates a strong rally that may see NASDAQ futures run back toward resistance from February and last December in the region north of 22,300.

The Relative Strength Index (RSI) at 65 allows for further animal spirits to play out, and the clear bias is upward until sentiment shifts.

Gold has sold off 2.85% in the premarket, and Treasury yields jump between 1% and 2.5% across the curve as investors sell safe-haven assets to reinvest in US equities.

NASDAQ 100 E-mini Futures

NASDAQ 100 E-mini Futures

Share: Feed news

Information on these pages contains forward-looking statements that involve risks and uncertainties. Markets and instruments profiled on this page are for informational purposes only and should not in any way come across as a recommendation to buy or sell in these assets. You should do your own thorough research before making any investment decisions. FXStreet does not in any way guarantee that this information is free from mistakes, errors, or material misstatements. It also does not guarantee that this information is of a timely nature. Investing in Open Markets involves a great deal of risk, including the loss of all or a portion of your investment, as well as emotional distress. All risks, losses and costs associated with investing, including total loss of principal, are your responsibility. The views and opinions expressed in this article are those of the authors and do not necessarily reflect the official policy or position of FXStreet nor its advertisers. The author will not be held responsible for information that is found at the end of links posted on this page.

If not otherwise explicitly mentioned in the body of the article, at the time of writing, the author has no position in any stock mentioned in this article and no business relationship with any company mentioned. The author has not received compensation for writing this article, other than from FXStreet.

FXStreet and the author do not provide personalized recommendations. The author makes no representations as to the accuracy, completeness, or suitability of this information. FXStreet and the author will not be liable for any errors, omissions or any losses, injuries or damages arising from this information and its display or use. Errors and omissions excepted.

The author and FXStreet are not registered investment advisors and nothing in this article is intended to be investment advice.

Recommended content


Recommended content

Editors’ Picks

GBP/USD: Upside stalls below 1.3500 after weak UK Retail Sales data

GBP/USD: Upside stalls below 1.3500 after weak UK Retail Sales data

GBP/USD pares gains while trading under 1.3500 in European trading on Friday. The pair stalls its upside after the Pound Sterling faces headwinds from the downbeat UK Retail Sales data for May. Broad US Dollar weakness, amid easing Middle East tensions, keeps the major underpinned. 

EUR/USD holds firm above 1.1500 amid US Dollar pullback

EUR/USD holds firm above 1.1500 amid US Dollar pullback

EUR/USD continues its winning streak for the third successive day, holding firm above 1.1500 in the European session on Friday. The pair stands tall as the US Dollar loses ground, possibly driven by a technical pullback and receding fears over a likely US military attack on Iran. Geopolitics remain in focus. 

Gold price remains on track for weekly losses amid hawkish Fed

Gold price remains on track for weekly losses amid hawkish Fed

Gold price maintains its offered tone through the early European session on Friday and remains on track to register weekly losses. The Federal Reserve's hawkish pause earlier this week is seen acting as a tailwind for the US Dollar and turning out to be a key factor driving flows away from the non-yielding yellow metal.

Shiba Inu Price Forecast: SHIB demand wanes as holders offload meme tokens 

Shiba Inu Price Forecast: SHIB demand wanes as holders offload meme tokens 

Shiba Inu (SHIB) extends its decline at the time of writing on Friday after dropping nearly 5% so far this week. The on-chain data supports a correction ahead, as SHIB holders are unloading tokens amid the escalating Iran-Israel war.

In the Eurozone, inflation is also a monetary phenomenon

In the Eurozone, inflation is also a monetary phenomenon

Monetary aggregates continue to be closely monitored by the European Central Bank (ECB), a sign that, despite the passage of time and the increasing complexity of financing circuits, quantitative theory remains relevant. 

The Best brokers to trade EUR/USD

The Best brokers to trade EUR/USD

SPONSORED Discover the top brokers for trading EUR/USD in 2025. Our list features brokers with competitive spreads, fast execution, and powerful platforms. Whether you're a beginner or an expert, find the right partner to navigate the dynamic Forex market.

Forex MAJORS

Cryptocurrencies

Signatures

Best Brokers of 2025