Dow Jones Industrial Average rips higher as CPI drives rate cut bets higher
- The Dow Jones rocketed to new all-time highs on Thursday.
- US CPI inflation clocked in roughly around expectations, cementing odds of a Fed rate cut next week.
- UoM Consumer Sentiment figures due on Friday are unlikely to shift the needle.

The Dow Jones Industrial Average (DJIA) found a new record high on Thursday, climbing over 600 points at its peak and tapping 46,111 for the first time ever. US Consumer Price Index (CPI) inflation came in roughly around expectations for August, pinning hopes for a September rate cut from the Federal Reserve (Fed) to the ceiling.
Headline CPI inflation rose again in August, with the annualized index rising to 2.9% and the monthly number accelerating to 0.4% as front-end inflationary pressure continues to build. Shelter and food prices were the largest drivers of near-term inflationary pressure, with the grocery items index rising 0.5% over a single month. Core CPI inflation, or headline inflation less energy and food prices, rose to 2.9% YoY, landing within median market forecasts.
CPI inflation uptick keeps rate cut bets on the rails
Despite another rise in key inflation pressure, August’s CPI inflation data wasn’t enough to derail market expectations for a Fed interest rate cut next week. According to the CME’s FedWatch Tool, interest rate futures traders are fully pricing in three rate cuts before the end of the year. A 25-basis-point cut is a foregone conclusion at the Federal Open Market Committee’s (FOMC) interest rate decision on September 17, and rate markets are pricing in nearly 95% odds that the Fed will deliver follow-up rate trims on October 29 and December 10.
University of Michigan (UoM) Consumer Sentiment Index data is due on Friday, but the datapoint is unlikely to result in any meaningful shifts in market sentiment. The aggregated survey index is expected to tick down to 58.0 from 58.2.
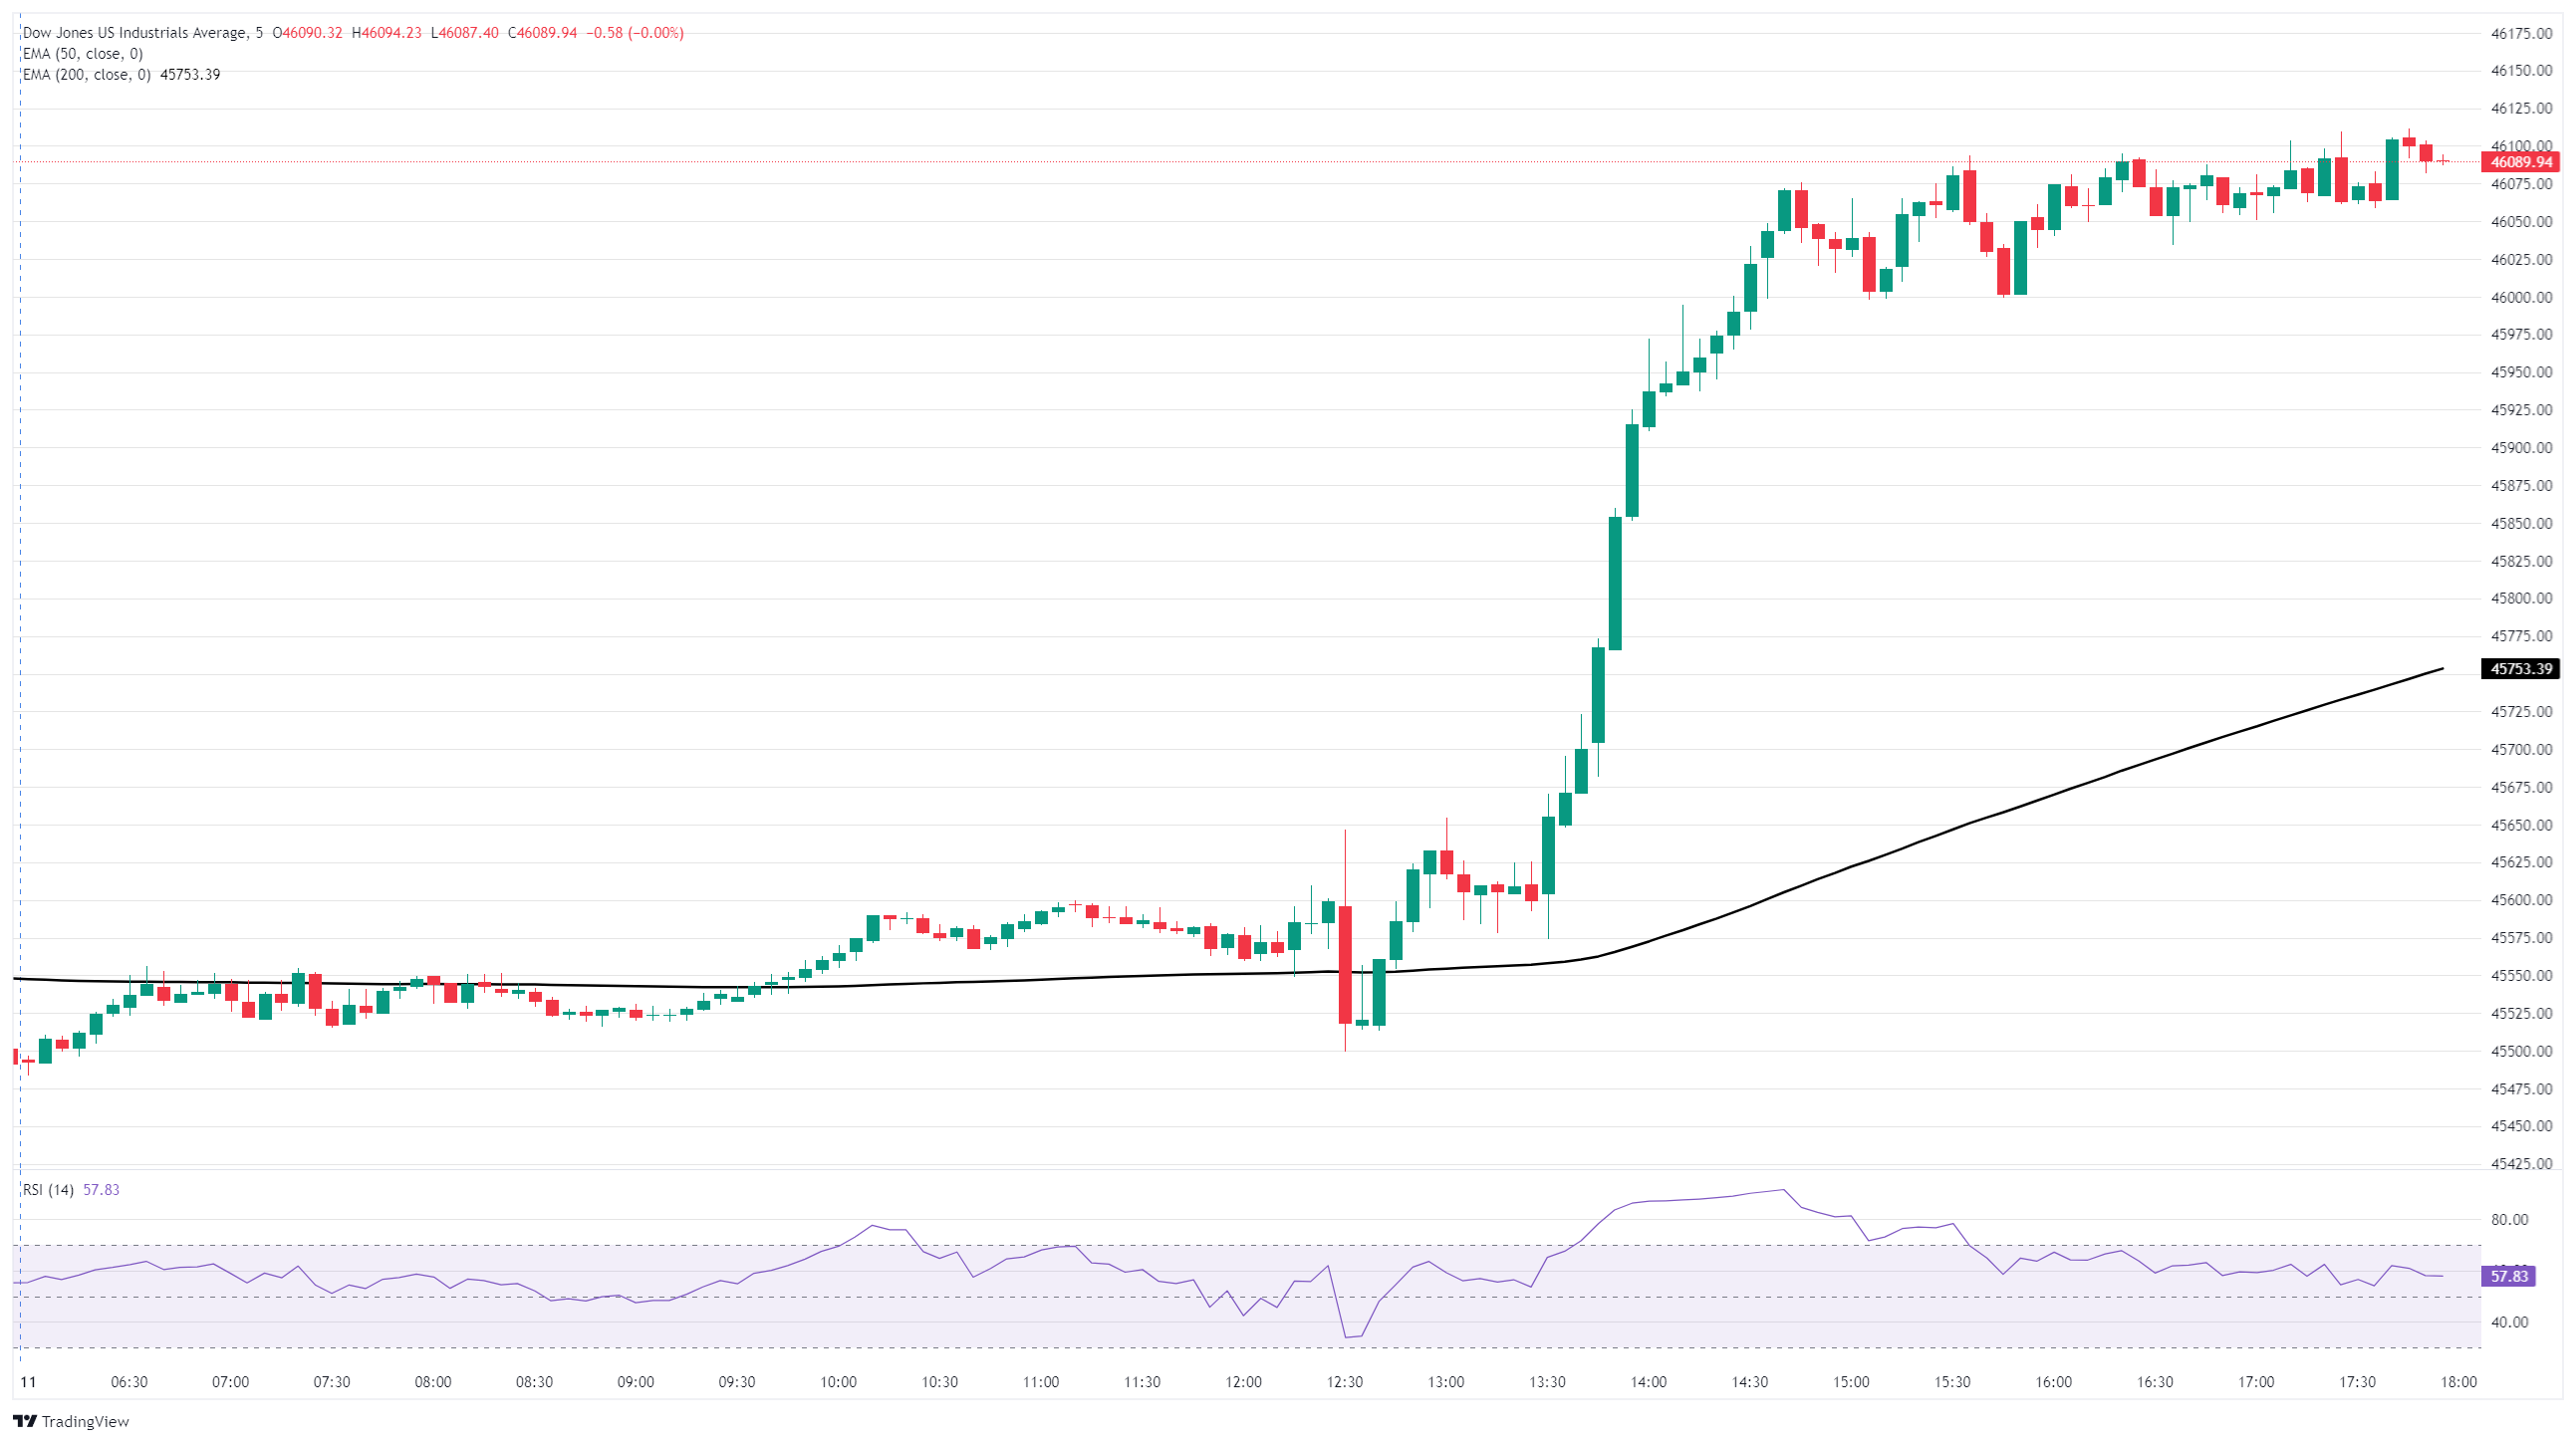
Dow Jones 5-minute chart
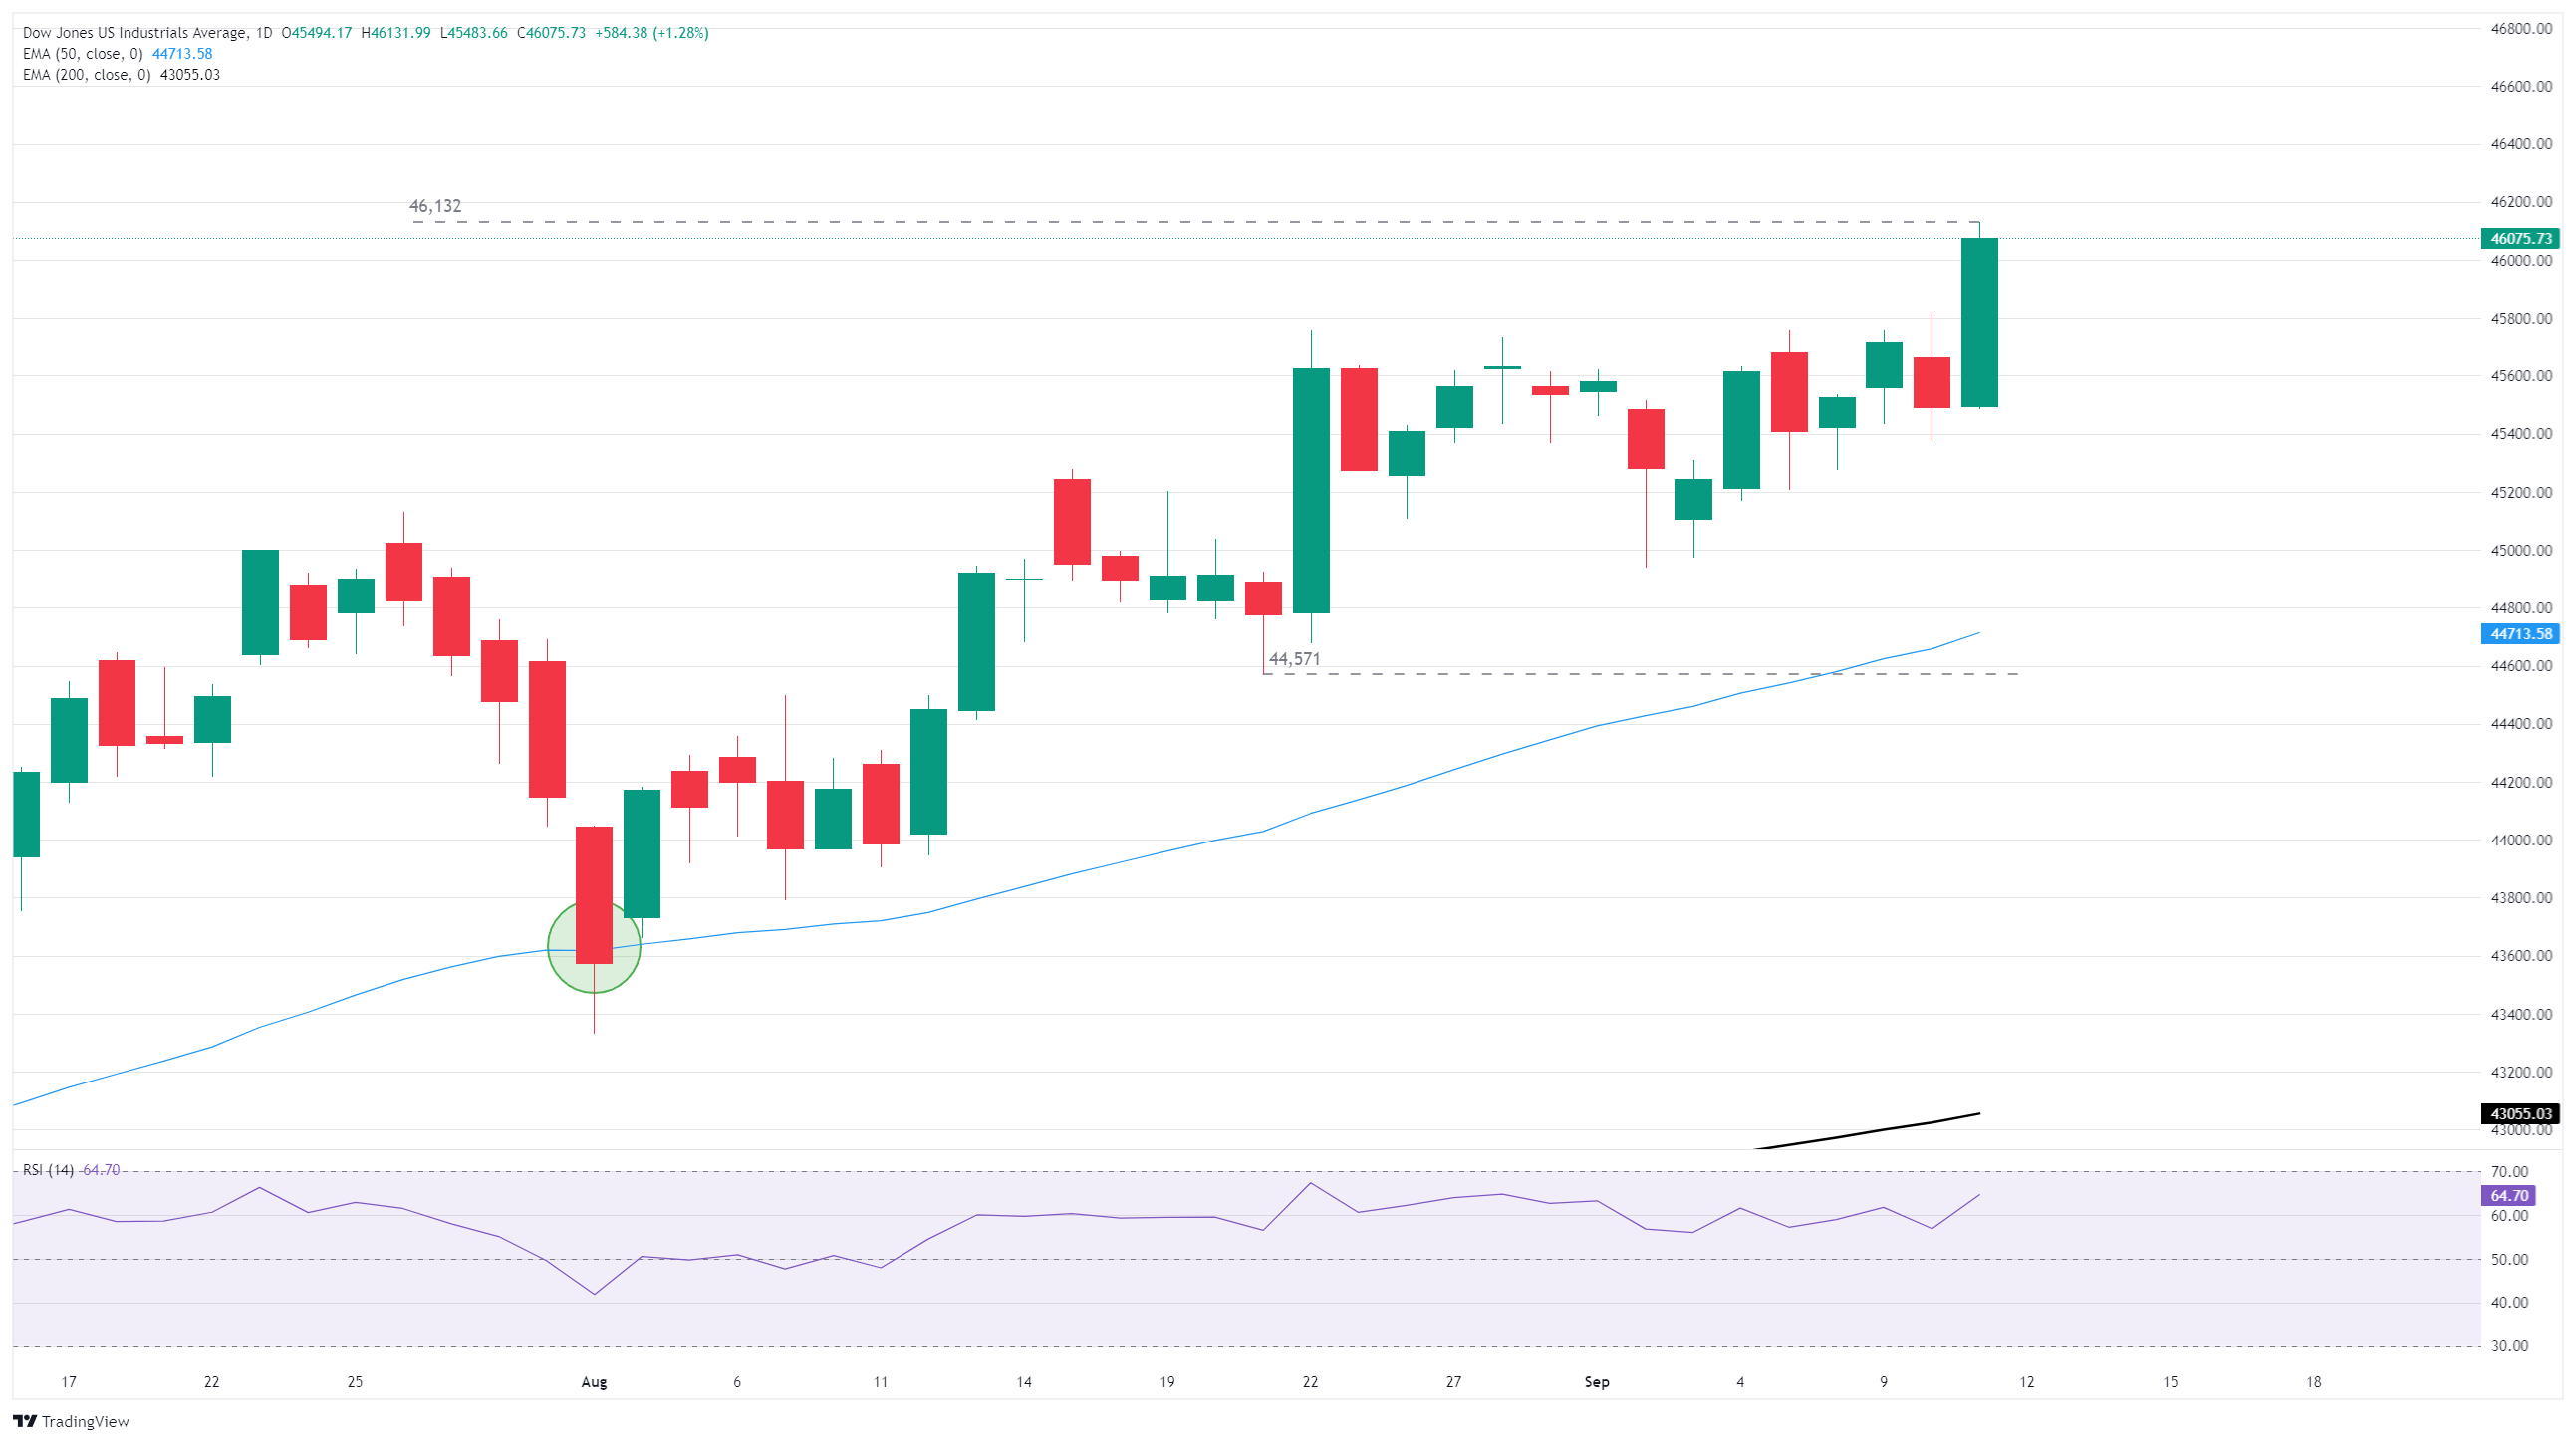
Dow Jones daily chart
Economic Indicator
Consumer Price Index ex Food & Energy (YoY)
Inflationary or deflationary tendencies are measured by periodically summing the prices of a basket of representative goods and services and presenting the data as the Consumer Price Index (CPI). CPI data is compiled on a monthly basis and released by the US Department of Labor Statistics. The YoY reading compares the prices of goods in the reference month to the same month a year earlier. The CPI Ex Food & Energy excludes the so-called more volatile food and energy components to give a more accurate measurement of price pressures. Generally speaking, a high reading is bullish for the US Dollar (USD), while a low reading is seen as bearish.
Read more.Last release: Thu Sep 11, 2025 12:30
Frequency: Monthly
Actual: 3.1%
Consensus: 3.1%
Previous: 3.1%
Source: US Bureau of Labor Statistics
The US Federal Reserve has a dual mandate of maintaining price stability and maximum employment. According to such mandate, inflation should be at around 2% YoY and has become the weakest pillar of the central bank’s directive ever since the world suffered a pandemic, which extends to these days. Price pressures keep rising amid supply-chain issues and bottlenecks, with the Consumer Price Index (CPI) hanging at multi-decade highs. The Fed has already taken measures to tame inflation and is expected to maintain an aggressive stance in the foreseeable future.
Author

Joshua Gibson
FXStreet
Joshua joins the FXStreet team as an Economics and Finance double major from Vancouver Island University with twelve years' experience as an independent trader focusing on technical analysis.


