Dow Jones Industrial Average sinks as markets flee to safety
- The Dow Jones sank 650 points on Thursday.
- Market rotation out of the AI rally has spread to ‘economic’ stocks.
- US economic data sours as job cuts soar and unemployment claims rise.

The Dow Jones Industrial Average (DJIA) took another header on Thursday, tumbling 650 points and following the rest of the market lower as investors rotate firmly into a flight for safety. Broader equity indexes are down across the board, and the VIX “fear index” is sitting at its highest levels since last November.
Equity rout drags crypto and metals markets lower
The Dow Jones’ 650-point (-1.3%) tumble was matched by a 100-point decline (-1.44%) in the S&P 500 and an accelerating 415-point (-1.82%) drop in the tech-heavy Nasdaq. Despite posting upbeat earnings, Google parent Alphabet (GOOGL) shares sank over 5% after investors balked at the tech giant’s expected AI capex rising to $185 billion in 2026. Qualcomm (QCOM) also fell around 8% as the global AI-fueled chip memory shortage forced the company to soften its forward guidance for the upcoming year.
Spot Gold and Silver prices are taking fresh hits on Thursday. Spot Gold prices are down 2.2% on the day, with Silver bids down sharply, sinking 15.5%. Bitcoin also turned even more bearish, falling nearly 8% and sinking below 68,000 for the first time since late 2024.
US economic data continues to sour
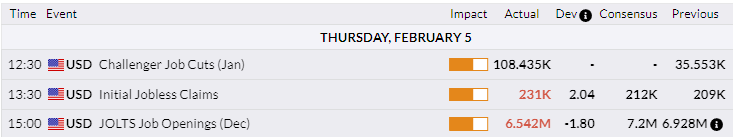
Investors are struggling to shrug off downbeat US economic data. US Initial Jobless Claims rose to 231K, well above the 212K forecast. US Challenger Job Cuts also soared, hitting 108.435K net job reductions, the worst January print since the tail end of the global financial crisis in 2009. JOLTS Job Openings also took a turn for the worse, sinking to 6.542M versus the expected upswing to 7.2M.
Dow Jones Daily chart
Technical Analysis
In the daily chart, DJIA trades at 48,846.92. Price sits above a rising 50-day EMA at 48,558.27 and remains well above the 200-day EMA at 46,128.31, keeping the medium-term trend pointed higher. The Stochastic (14,5,5) has eased from overbought to 52.65, signaling moderating upside momentum and scope for consolidation.
The trend bias stays bullish while the short-term EMA climbs and maintains its lead over the long-term measure. If momentum fades further, price could pull back toward support at 48,558.27, with deeper support at 46,128.31. A renewed uptick in the oscillator would revive the advance, keeping the focus on trend continuation rather than reversal.
(The technical analysis of this story was written with the help of an AI tool.)
Dow Jones FAQs
The Dow Jones Industrial Average, one of the oldest stock market indices in the world, is compiled of the 30 most traded stocks in the US. The index is price-weighted rather than weighted by capitalization. It is calculated by summing the prices of the constituent stocks and dividing them by a factor, currently 0.152. The index was founded by Charles Dow, who also founded the Wall Street Journal. In later years it has been criticized for not being broadly representative enough because it only tracks 30 conglomerates, unlike broader indices such as the S&P 500.
Many different factors drive the Dow Jones Industrial Average (DJIA). The aggregate performance of the component companies revealed in quarterly company earnings reports is the main one. US and global macroeconomic data also contributes as it impacts on investor sentiment. The level of interest rates, set by the Federal Reserve (Fed), also influences the DJIA as it affects the cost of credit, on which many corporations are heavily reliant. Therefore, inflation can be a major driver as well as other metrics which impact the Fed decisions.
Dow Theory is a method for identifying the primary trend of the stock market developed by Charles Dow. A key step is to compare the direction of the Dow Jones Industrial Average (DJIA) and the Dow Jones Transportation Average (DJTA) and only follow trends where both are moving in the same direction. Volume is a confirmatory criteria. The theory uses elements of peak and trough analysis. Dow’s theory posits three trend phases: accumulation, when smart money starts buying or selling; public participation, when the wider public joins in; and distribution, when the smart money exits.
There are a number of ways to trade the DJIA. One is to use ETFs which allow investors to trade the DJIA as a single security, rather than having to buy shares in all 30 constituent companies. A leading example is the SPDR Dow Jones Industrial Average ETF (DIA). DJIA futures contracts enable traders to speculate on the future value of the index and Options provide the right, but not the obligation, to buy or sell the index at a predetermined price in the future. Mutual funds enable investors to buy a share of a diversified portfolio of DJIA stocks thus providing exposure to the overall index.
Author

Joshua Gibson
FXStreet
Joshua joins the FXStreet team as an Economics and Finance double major from Vancouver Island University with twelve years' experience as an independent trader focusing on technical analysis.


