Dow Jones Industrial Average extends recovery on Monday
- The Dow Jones rallied 600 points at its peak on Monday as the index extends its rebound.
- Equities are recovering their stance after a recent plunge on geopolitical concerns.
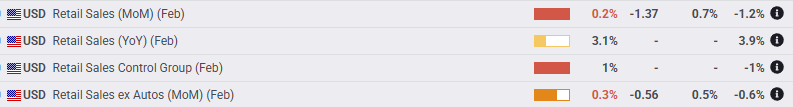
- US Retail Sales figures from February recovered, but not by much.

The Dow Jones Industrial Average (DJIA) climbed around 600 points on Monday at its highest as equities continue to claw back ground after a recent downturn that saw major indexes inch toward correction territory. US economic data continues to hint at a possible slowdown looming ahead, but oversold equity markets are shrugging off the warning signs falling too far, too quickly over the last few weeks.
US Retail Sales rebounded to a tepid 0.2% MoM in February after January’s plunge. Markets were hoping for a better showing from key retail activity results, with a median forecast of 0.7%. Data watchers will note that January’s figure was also revised to a two-year low of -1.2%, and downside revisions will continue to plague the economic calendar as US data continues to worsen on the front end of the curve.
Despite a near-term rebound in equity markets, key indexes remain steeply lower in March, sparked by overarching tariff threats from the Trump administration. US President Donald Trump has played fast and loose with his constantly changing tariff threats, introducing a new level of policy friction that markets have yet to become accustomed to. Despite President Trump flat-out refusing to acknowledge a growing risk of recession at the hands of his trade policies, key comments from people within his administration have tipped their hands that Trump’s team expect some “economic pain”. However, the Trump administration’s attempt to rebrand economic contraction as “resetting US markets” seems to have gone over rather poorly with investors.
Dow Jones news
The Dow Jones has extended into a second day of recovery gains, with the majority of the major equity index rising on Monday. UnitedHealth (UNH), Walmart (WM), and IBM (IBM) have all risen over 2% on the day. UNH rose back to $500 per share, Walmart climbed back over $85 per share, and IBM has reclaimed $250 per share. On the low end, Nvidia fell back 2.5%, dipping back below $120 per share as the tech rally continues to face difficulties.
Dow Jones price forecast
The Dow Jones Industrial Average is seeking a technical recovery following a rapid rebalancing of investor expectations: the Dow Jones has climbed 600 points on Monday, adding further momentum to last Friday’s 550-point gain. However, the key index remains steeply off of recent highs, declining over 3,300 points top-to-bottom over the last two weeks.
Bidding pressure is pushing the Dow Jones back toward the 200-day Exponential Moving Average (EMA) at the 42,000 handle. The DJIA found a technical floor at the 41,000 key price level, but buyers remain at the low end of a particularly steep hole as the Dow trades 3,300 points below record highs set last November just north of 45,000.
Dow Jones daily chart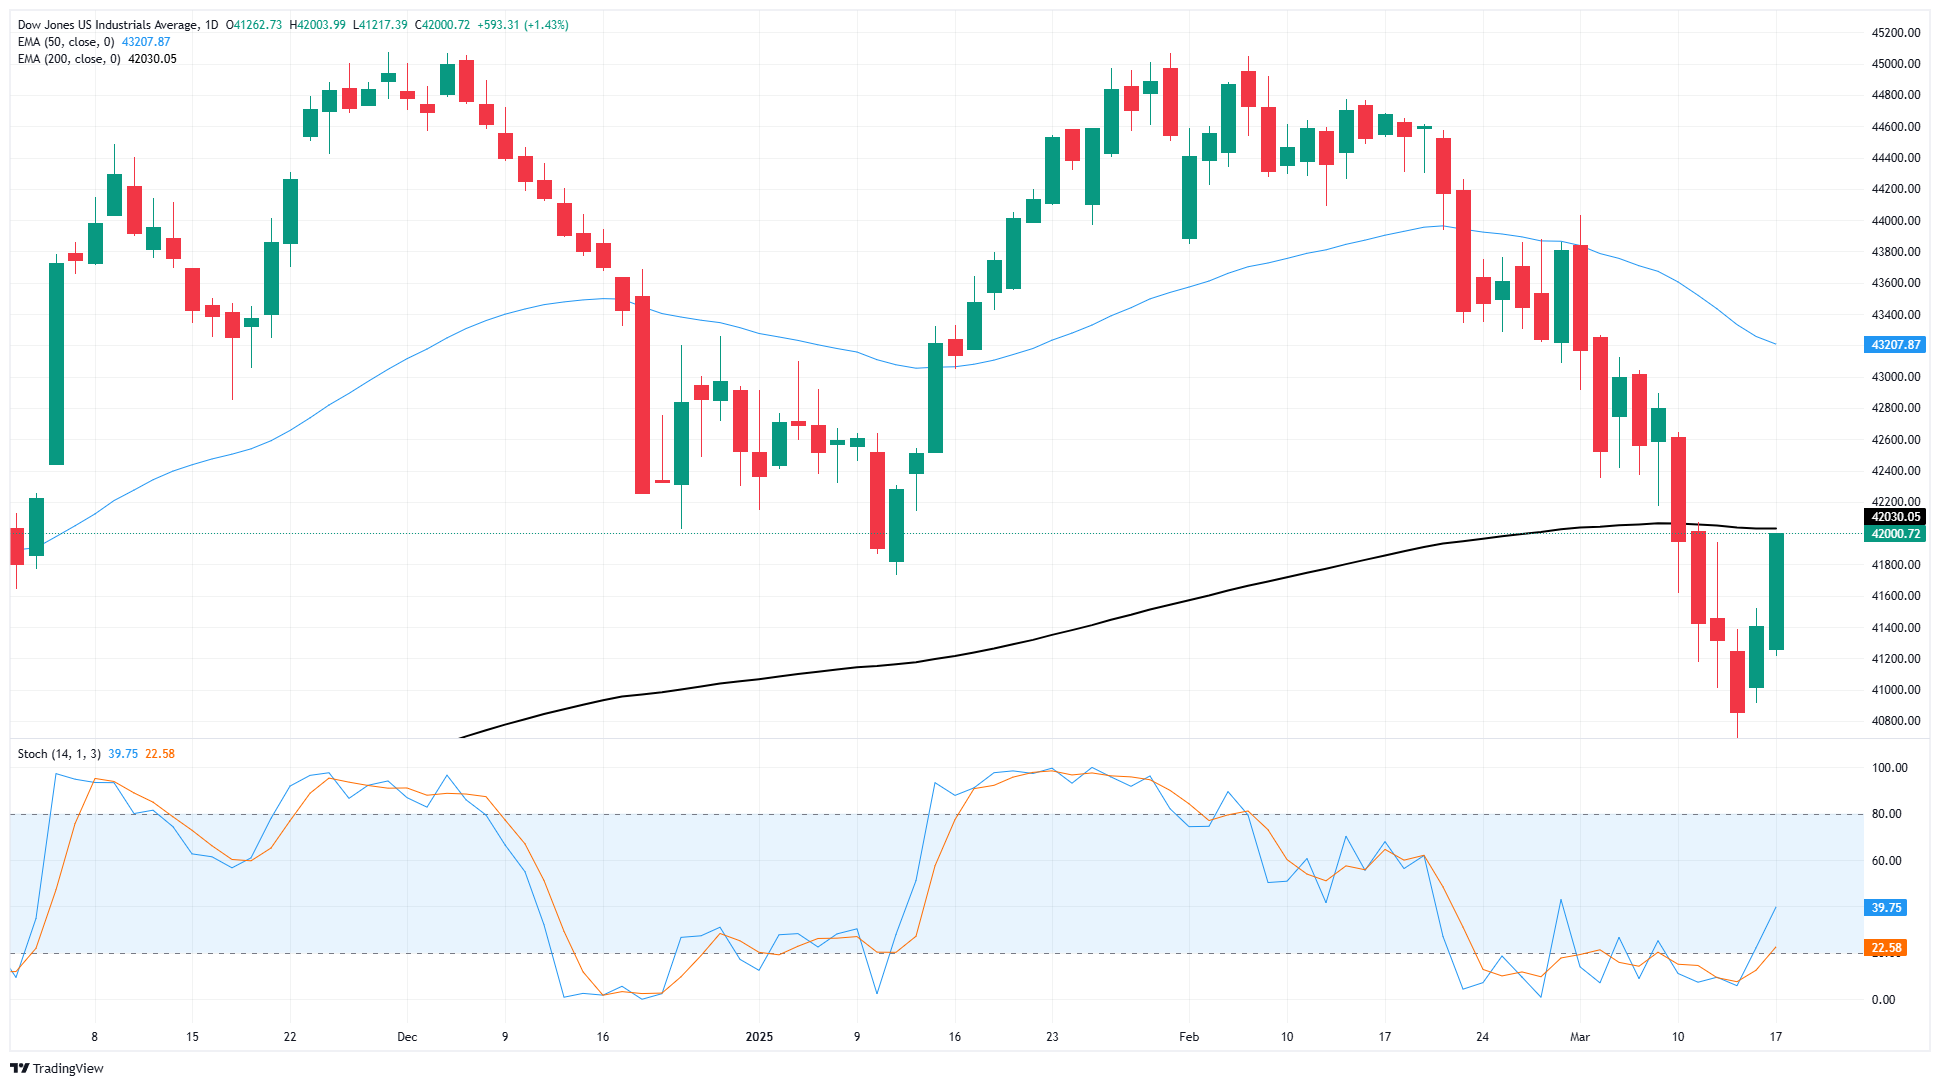
Dow Jones FAQs
The Dow Jones Industrial Average, one of the oldest stock market indices in the world, is compiled of the 30 most traded stocks in the US. The index is price-weighted rather than weighted by capitalization. It is calculated by summing the prices of the constituent stocks and dividing them by a factor, currently 0.152. The index was founded by Charles Dow, who also founded the Wall Street Journal. In later years it has been criticized for not being broadly representative enough because it only tracks 30 conglomerates, unlike broader indices such as the S&P 500.
Many different factors drive the Dow Jones Industrial Average (DJIA). The aggregate performance of the component companies revealed in quarterly company earnings reports is the main one. US and global macroeconomic data also contributes as it impacts on investor sentiment. The level of interest rates, set by the Federal Reserve (Fed), also influences the DJIA as it affects the cost of credit, on which many corporations are heavily reliant. Therefore, inflation can be a major driver as well as other metrics which impact the Fed decisions.
Dow Theory is a method for identifying the primary trend of the stock market developed by Charles Dow. A key step is to compare the direction of the Dow Jones Industrial Average (DJIA) and the Dow Jones Transportation Average (DJTA) and only follow trends where both are moving in the same direction. Volume is a confirmatory criteria. The theory uses elements of peak and trough analysis. Dow’s theory posits three trend phases: accumulation, when smart money starts buying or selling; public participation, when the wider public joins in; and distribution, when the smart money exits.
There are a number of ways to trade the DJIA. One is to use ETFs which allow investors to trade the DJIA as a single security, rather than having to buy shares in all 30 constituent companies. A leading example is the SPDR Dow Jones Industrial Average ETF (DIA). DJIA futures contracts enable traders to speculate on the future value of the index and Options provide the right, but not the obligation, to buy or sell the index at a predetermined price in the future. Mutual funds enable investors to buy a share of a diversified portfolio of DJIA stocks thus providing exposure to the overall index.
Author

Joshua Gibson
FXStreet
Joshua joins the FXStreet team as an Economics and Finance double major from Vancouver Island University with twelve years' experience as an independent trader focusing on technical analysis.


